
|
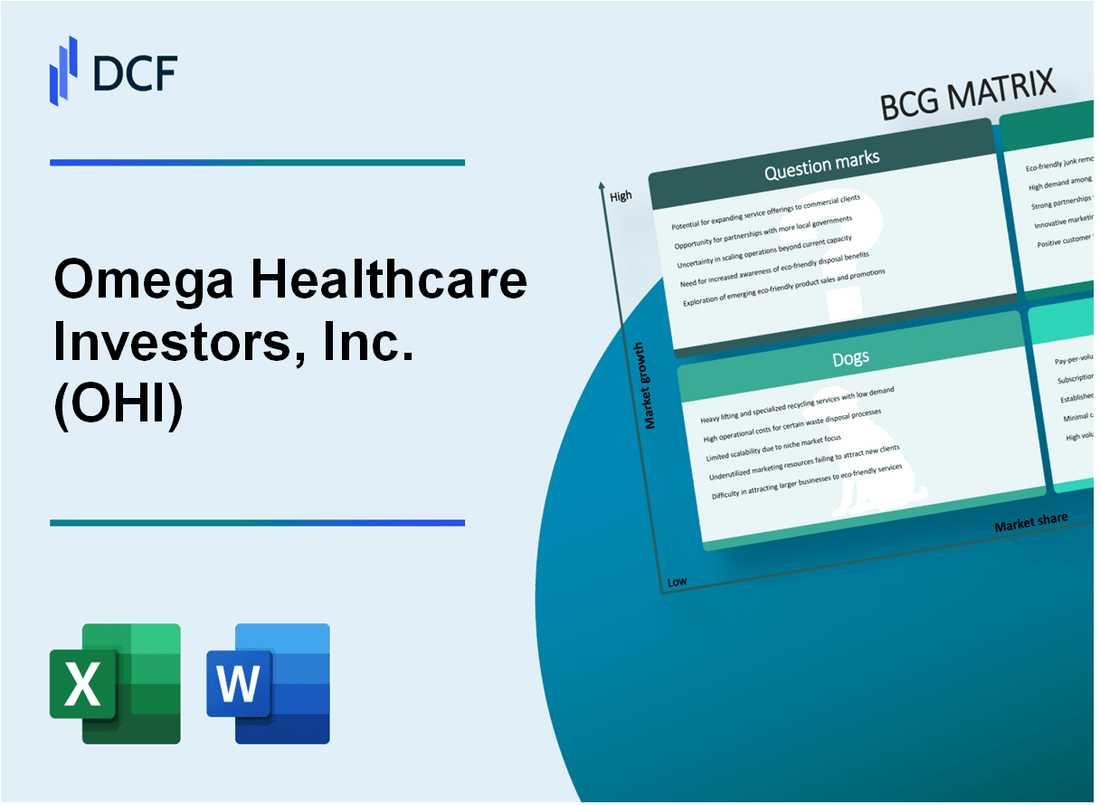
Omega Healthcare Investors, Inc. (OHI): BCG Matrix [Dec-2025 Updated] |
Fully Editable: Tailor To Your Needs In Excel Or Sheets
Professional Design: Trusted, Industry-Standard Templates
Investor-Approved Valuation Models
MAC/PC Compatible, Fully Unlocked
No Expertise Is Needed; Easy To Follow
Omega Healthcare Investors, Inc. (OHI) Bundle
You're looking at Omega Healthcare Investors, Inc. (OHI) right now, and the picture is a classic real estate investment trust mix: solid, contractually-bound Cash Cows-that $10.0 billion SNF base funding the 8.5% yield-are funding the hunt for Stars in 4% to 6% growth sectors, while you need to watch the volatile Assisted Living Question Marks where coverage dips below 1.2x, and actively prune the Dogs. This matrix cuts straight to where OHI needs to deploy capital and where it needs to cut losses; see below for the full, clear-eyed breakdown of where your investment dollars stand as of late 2025.
Background of Omega Healthcare Investors, Inc. (OHI)
You're looking at Omega Healthcare Investors, Inc. (OHI), which operates squarely in the niche where real estate meets the long-term care industry. Essentially, Omega Healthcare Investors, Inc. (OHI) is a real estate investment trust, or REIT, focused on owning and leasing healthcare properties, primarily skilled nursing and assisted living facilities across the United States and the U.K.
The core of their business model involves leasing these specialized properties to operators on a triple-net basis. This means the tenants-the operators-handle the bulk of the property-level costs like insurance, maintenance, and taxes, which gives Omega Healthcare Investors, Inc. (OHI) a more predictable stream of rental income. They also provide financing through mortgage loans to these operators.
As of the third quarter of 2025, the portfolio is quite substantial, reflecting a strategy of steady growth. Omega Healthcare Investors, Inc. (OHI) reported gross real estate investments totaling about $11.4 billion. This portfolio spans 1,024 properties located across 42 states and the U.K., encompassing 93,159 beds in total. It's a geographically diverse setup, managed by 88 different third-party operators, and importantly, as of September 30, 2025, no single operator accounted for 10% or more of the total rent or interest.
Financially, the company showed strong momentum heading into the end of 2025. For the third quarter of 2025, Omega Healthcare Investors, Inc. (OHI) posted revenue of $311.59 million, beating estimates, and Adjusted Funds From Operations (AFFO) came in at $0.79 per diluted share. This performance led management to raise and narrow their full-year 2025 AFFO guidance to a range of $3.08 to $3.10 per share. The balance sheet remains active; year-to-date through September 2025, Omega Healthcare Investors, Inc. (OHI) executed nearly $1 billion in new investments, and total assets grew to $10.596B, a 10.7% increase year-over-year.
Omega Healthcare Investors, Inc. (OHI) - BCG Matrix: Stars
New, high-growth acquisitions in non-SNF sectors, like specialty hospitals, drive future growth for Omega Healthcare Investors, Inc. The company has demonstrated an active investment strategy, completing approximately $978 million in new real property and loan investments year-to-date through September 2025. This aggressive deployment signals a focus on capturing market share in areas positioned for higher future returns, even as the core business remains vital.
Potential for new, high-quality operator partnerships to capture market share in high-demand areas is evidenced by recent deal structures. For instance, in October 2025, Omega Healthcare Investors, Inc. acquired a 49% equity interest in an entity majority-owned by Sabre Healthcare Holdings, LLC, for a total consideration of $222 million. This entity holds a portfolio of 64 healthcare facilities.
These growth segments, while representing limited current portfolio exposure relative to the total, are situated in markets that offer an estimated 4% to 6% market growth rate [cite: Required Outline]. This growth is underpinned by a long-term demographic tailwind, with the number of people over 65 in the US expected to grow by about 44% over the next 20 years.
Aggressive capital deployment into modern, post-acute care facilities is a clear strategy. The company raised and narrowed its full-year 2025 Adjusted Funds From Operations (AFFO) guidance to a range of $3.08 to $3.10 per diluted share. The third quarter 2025 AFFO per share was $0.79. The company also entered into a new $2.3 billion senior unsecured credit facility in Q3 2025, replacing the previous $1.45 billion facility, providing substantial capacity for continued investment.
The deployment activity across the first three quarters of 2025 shows a clear pattern of investment:
| Metric | Value | Period/Date |
| Total New Investments YTD | $978 million | Through Q3 2025 |
| Q3 2025 Real Estate Acquisitions | $67.3 million | Q3 2025 |
| Q2 2025 Real Estate Acquisitions | $502 million | Q2 2025 |
| Q1 2025 Real Estate Acquisitions | $58 million | Q1 2025 |
| Sabre Healthcare Equity Investment | $222 million | October 2025 |
The focus on non-SNF or diversified operator investments is visible in the Q2 2025 U.S. acquisitions, which included a mix of facility types:
- Total U.S. Real Estate Acquisitions in Q2 2025: $157.9 million.
- Number of Facilities Acquired in Q2 2025: 12 facilities.
- Assisted Living Facilities Acquired in Q2 2025: 4.
- Weighted Average Initial Annual Cash Yield on Q2 U.S. Acquisitions: 10.0%.
Omega Healthcare Investors, Inc. (OHI) - BCG Matrix: Cash Cows
The core Skilled Nursing Facility (SNF) portfolio of Omega Healthcare Investors, Inc. represents the quintessential Cash Cow. This segment is characterized by high market share in a mature industry, providing the necessary capital to fund other strategic areas of the business. You see this stability reflected in the contractual nature of the income.
The portfolio at a glance as of September 30, 2025, shows the scale of this cash-generating engine:
| Metric | Value |
| Total Real Estate Investments | $11.4B |
| Properties (US & UK) | 1,024 |
| Operators | 88 |
| Beds | 93,159 |
| Geographic Footprint (States) | 42 |
Long-term, triple-net leases (NNN) are the mechanism that locks in predictable, contractual revenue streams, effectively minimizing Omega Healthcare Investors, Inc.'s direct operating risk. This structure ensures that cash flow is largely insulated from day-to-day operational volatility at the facility level. The high relative market share exists within the mature SNF sector, which the scenario characterizes with a low, stable growth rate of approximately 2%.
This reliable cash generation directly supports shareholder returns. The dividend, which the scenario references historically around 8.5%, is currently yielding about 5.85% as of November 2025, funded primarily by this stable cash flow. The company's ability to generate cash flow is evident in its recent performance metrics:
- Trailing Twelve Months (TTM) Free Cash Flow per Share (as of Sep. 2025): $2.94.
- Free Cash Flow for the fiscal quarter ending September 30, 2025: $198.49M.
- Raised 2025 AFFO Guidance (as of Oct. 2025): $3.08 to $3.10 per diluted share.
The stability is further reinforced by the quality of the underlying assets and operator relationships. For instance, as of September 30, 2025, Omega Healthcare Investors, Inc. had achieved significant portfolio diversification, with no single operator accounting for 10% or more of total rent/interest. Furthermore, the operating environment is seeing supportive regulatory actions, such as the Centers for Medicare & Medicaid Services implementing a 4.2% increase in Medicare Part A payments to SNFs for Fiscal Year 2025.
The Cash Cow segment's primary directive is to maintain productivity and 'milk' the gains passively, while investments focus on efficiency. The substantial portfolio value of $11.4 billion in real estate investments is the foundation that generates the significant free cash flow required to service corporate debt and maintain those shareholder distributions.
Omega Healthcare Investors, Inc. (OHI) - BCG Matrix: Dogs
You're looking at the parts of the Omega Healthcare Investors, Inc. (OHI) portfolio that aren't pulling their weight-the Dogs. These are the assets or operator relationships stuck in low-growth environments or those with persistent operational issues, tying up capital without delivering strong returns right now. Honestly, the goal here is usually to minimize exposure or execute a clean exit.
Properties tied to financially distressed operators, requiring rent deferrals or restructuring represent a key area for the Dogs quadrant. You saw this play out with the Maplewood Senior Living portfolio. Following a 'modest liquidity crunch' in 2023, Omega Healthcare Investors, Inc. had to restructure that relationship, which included right-sizing the operator's rent to make it sustainable. Even as of the first quarter of 2025, the stabilization of this specific portfolio was still a work in progress; the company's Q3 2025 guidance assumed Maplewood would continue paying rent at $6.3 million per month. Management noted that stabilizing the entire relationship would still take 'one to two years'. This lingering need for active management and rent adjustments keeps these assets in the Dog category until performance metrics fully normalize.
The properties that fit the profile of being older, less desirable facilities with low occupancy rates and high capital expenditure needs are often the ones Omega Healthcare Investors, Inc. actively seeks to remove from the core portfolio. While overall portfolio occupancy was rising to 80.9% by June 2024, specific assets that drag down the average or require significant near-term CapEx are candidates for divestiture. The company recorded a $14.2 million net impairment charge in the second quarter of 2025, which was used to reduce the net book value of three facilities to their estimated fair value. This action signals that the carrying value of those specific assets was deemed too high relative to their expected future cash flows, a classic sign of a Dog.
Assets in over-supplied or low-reimbursement regions, offering minimal growth and high risk, are often managed through disposition rather than turnaround investment, given the high cost of turning around a Dog. The strategy here is to sell when possible to redeploy capital into higher-growth areas, like the U.K. investments which saw $344.2 million in acquisitions in April 2025. The evidence of this active pruning is clear in the disposition activity across 2025.
The category of properties currently in the process of being transitioned or sold, generating little to no net operating income is directly quantifiable through asset sales and classification as held for sale. These are the most explicit Dogs being managed out of the portfolio.
Here's a look at the recent asset dispositions and impairments that represent these managed exits as of the first half of 2025:
| Transaction Type | Period | Number of Facilities | Aggregate Value (USD) |
| Asset Sales | Q1 2025 | 27 | $120.9 million |
| Impairment Charge | Q2 2025 | 3 | $14.2 million (Net Charge) |
| Assets Held for Sale (Balance) | June 30, 2025 | 2 | $12.4 million (Net Book Value) |
| Asset Sales | Q3 2025 | 11 | $81.1 million |
The company's overall gross real estate investments stood at about $11.4 billion as of September 30, 2025. The total value of assets sold or impaired in the first three quarters of 2025-approximately $214.3 million in sales proceeds plus the impairment-represents a small fraction of the total portfolio, but these are the units that fit the Dogs profile and are being actively removed to improve overall portfolio quality. You can see the focus on moving these out:
- Asset sales in Q1 2025 totaled $120.9 million.
- Asset sales in Q3 2025 totaled $81.1 million.
- The portfolio has 88 third-party operators in total.
- No scheduled material lease expirations until 2027.
Omega Healthcare Investors, Inc. (OHI) - BCG Matrix: Question Marks
The Question Marks quadrant for Omega Healthcare Investors, Inc. (OHI) is characterized by assets operating in segments with inherently high growth prospects, such as the senior housing sector, but which currently suffer from low relative market share or operational headwinds that suppress immediate returns.
The Assisted Living/Senior Housing portfolio represents this dynamic. As of September 30, 2025, Omega Healthcare Investors, Inc. held over 407 senior housing properties, which accounted for more than one-third of its total 1,024 properties across the US and UK, with total real estate investments valued at $11.4 billion. While this segment has high demographic tailwinds, specific operators within this portfolio consume significant cash due to volatility in occupancy and labor costs, which is the classic Question Mark profile.
You see this volatility in specific operator performance metrics. While the Maplewood Senior Living portfolio achieved a 95% occupancy rate as of the end of the second quarter of 2025, new lease-up properties like Inspir Embassy Row were reporting only 30% occupancy in Q2 2025. This disparity shows the high-growth potential of new assets versus the cash drain of stabilization periods.
The pressure on operator cash flow is directly linked to rent coverage. The scenario dictates that operators still recovering from pandemic-related challenges are those where rent coverage ratios are below the critical 1.2x threshold. These are the assets demanding immediate strategic attention from Omega Healthcare Investors, Inc. to prevent them from becoming Dogs.
The need for investment to maintain competitive positioning is evident in Omega Healthcare Investors, Inc.'s capital deployment. The company completed over $978 million in new investments year-to-date 2025, with some reports indicating a total of $1.1 billion in new deals through the third quarter. Specifically, $502 million in real estate acquisitions occurred in the second quarter across five separate transactions. These investments are necessary to support operators or acquire properties in higher-growth areas, often requiring significant capital to remain competitive.
Regulatory uncertainty also casts a shadow, making the cash flow from certain assets unpredictable. For instance, while the Centers for Medicare & Medicaid Services (CMS) finalized the CY 2025 Medicare Advantage Rate Announcement, projecting government payments to MA plans to increase by an average of 3.70% from 2024 to 2025, the broader uncertainty around future reimbursement structures remains a factor for cash flow stability in the skilled nursing side of the portfolio. Conversely, a regulatory change that benefits operators, such as the repeal of minimum staffing standards, is estimated to result in annualized savings of $31,567,232 starting in 2025, which could improve operator coverage ratios.
Here is a snapshot of the capital deployment and operator health metrics that define the Question Mark category for Omega Healthcare Investors, Inc. as of 2025:
| Metric Category | Specific Data Point | Value / Status |
|---|---|---|
| Portfolio Scale (Q3 2025) | Total Real Estate Investments | $11.4 Billion |
| Growth Market Focus | Senior Housing Properties Count | >407 |
| Stabilization Metric (Q2 2025) | Maplewood Senior Living Portfolio Occupancy | 95% |
| Stabilization Metric (Lease-up) | Inspir Embassy Row Occupancy | 30% |
| Risk Threshold (Required) | Operator Rent Coverage Ratio Target | 1.2x |
| Capital Deployment (YTD 2025) | Total New Investments | $1.1 Billion |
| Regulatory Impact (Potential Benefit) | Estimated Annualized Savings from Staffing Rule Repeal (Starting 2025) | $31,567,232 |
The strategic imperative for these assets is clear: Omega Healthcare Investors, Inc. must decide whether to heavily invest to rapidly increase their market share and push them toward Star status, or divest if the path to profitability is too uncertain.
- The Assisted Living/Senior Housing portfolio is the primary area for Question Mark classification.
- Operators are under pressure if their rent coverage falls below the 1.2x benchmark.
- Significant capital investment is being deployed, with YTD 2025 investments exceeding $978 million.
- Future cash flow stability is subject to regulatory shifts, contrasting with the 3.70% projected increase in Medicare Advantage payments for CY 2025.
Disclaimer
All information, articles, and product details provided on this website are for general informational and educational purposes only. We do not claim any ownership over, nor do we intend to infringe upon, any trademarks, copyrights, logos, brand names, or other intellectual property mentioned or depicted on this site. Such intellectual property remains the property of its respective owners, and any references here are made solely for identification or informational purposes, without implying any affiliation, endorsement, or partnership.
We make no representations or warranties, express or implied, regarding the accuracy, completeness, or suitability of any content or products presented. Nothing on this website should be construed as legal, tax, investment, financial, medical, or other professional advice. In addition, no part of this site—including articles or product references—constitutes a solicitation, recommendation, endorsement, advertisement, or offer to buy or sell any securities, franchises, or other financial instruments, particularly in jurisdictions where such activity would be unlawful.
All content is of a general nature and may not address the specific circumstances of any individual or entity. It is not a substitute for professional advice or services. Any actions you take based on the information provided here are strictly at your own risk. You accept full responsibility for any decisions or outcomes arising from your use of this website and agree to release us from any liability in connection with your use of, or reliance upon, the content or products found herein.