
|
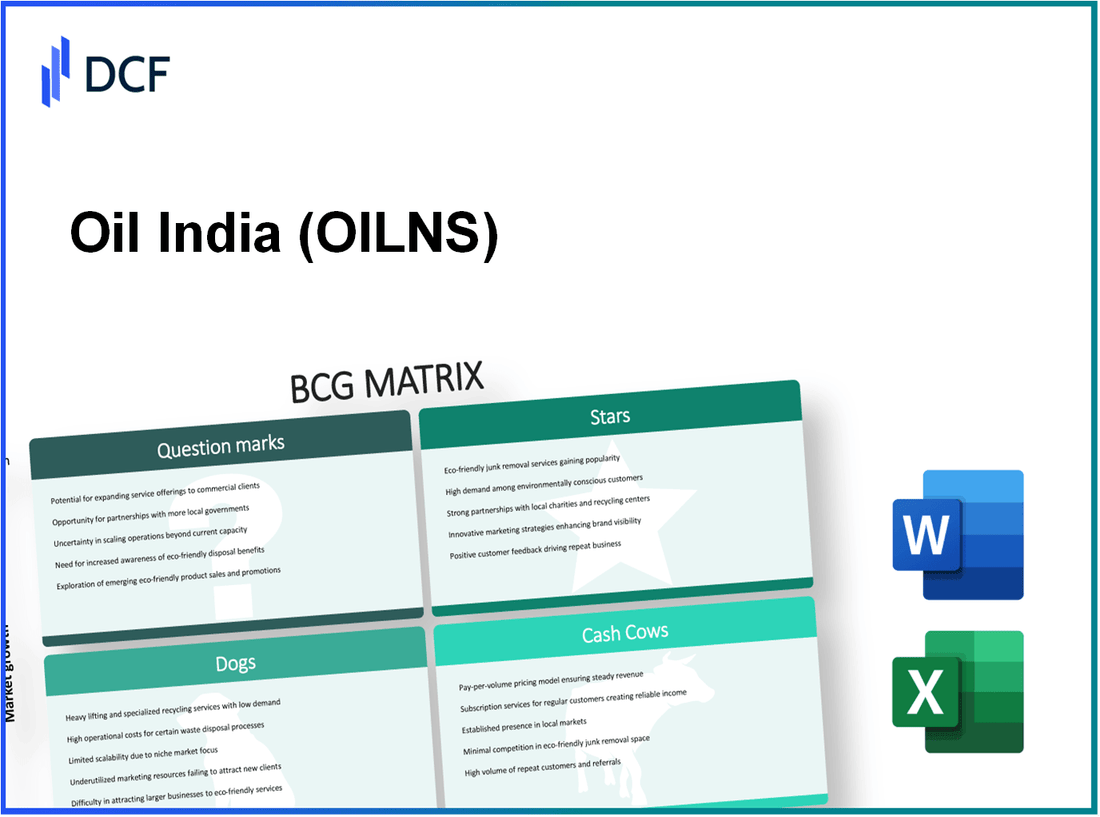
Oil India Limited (OIL.NS): BCG Matrix |
Fully Editable: Tailor To Your Needs In Excel Or Sheets
Professional Design: Trusted, Industry-Standard Templates
Investor-Approved Valuation Models
MAC/PC Compatible, Fully Unlocked
No Expertise Is Needed; Easy To Follow
Oil India Limited (OIL.NS) Bundle
In the dynamic world of oil and gas, understanding the strategic positioning of a company is crucial for investors and stakeholders alike. Oil India Limited, a key player in the industry, can be analyzed through the lens of the Boston Consulting Group (BCG) Matrix, revealing its Stars, Cash Cows, Dogs, and Question Marks. This framework not only highlights its strengths and weaknesses but also identifies growth opportunities and areas needing attention. Dive in to explore how Oil India Limited is navigating the complexities of its business landscape and what it means for future prospects!
Background of Oil India Limited
Oil India Limited (OIL) is a premier public sector oil and gas company based in India, with a robust history dating back to its inception in 1959. It is engaged in exploration, production, and transportation of crude oil and natural gas, playing a pivotal role in the energy sector of the country.
Headquartered in Noida, OIL operates across various regions, predominantly in the northeastern part of India. The company has expanded its operations beyond Indian borders and has undertaken several projects in countries like Russia, Vietnam, and Niger.
OIL is a significant contributor to India's energy security, producing approximately 3.2 million metric tonnes of crude oil and 7.75 billion cubic meters of natural gas annually. The company is also involved in refining, pipeline transportation, and has interests in renewable energy initiatives.
As a public sector enterprise, the Government of India holds a majority stake in Oil India Limited, which aligns its operational strategies with national energy policies. The company was listed on the Bombay Stock Exchange (BSE) and the National Stock Exchange (NSE), showcasing its financial performance to a broader audience.
OIL's revenue in the financial year 2022-2023 stood at approximately ₹22,000 crore, reflecting its strong market position and operational efficiency. Through various initiatives, such as technological advancements and sustainable practices, Oil India Limited strives to enhance its value proposition in the competitive landscape of the oil and gas industry.
Oil India Limited - BCG Matrix: Stars
Oil India Limited (OIL) demonstrates several characteristics of Stars in the BCG Matrix, particularly in its operations within the oil and gas sector where it holds a significant market share in high-growth areas. Below are the key areas where OIL excels as a Star.
Exploration in High-Potential Offshore Fields
OIL has been active in exploring offshore fields, significantly contributing to its revenue. In 2022, OIL reported an **increase of 28%** in production from its offshore operations as a result of focused exploration initiatives. The company's total production during FY 2022-23 was **3.40 million metric tons**, bolstered by successful explorations in the **Northeast and Andaman** regions.
Renewable Energy Projects
The company is expanding its portfolio in renewable energy, aiming to diversify its revenue streams. As of 2023, OIL has set a target of achieving **1,000 megawatts (MW)** of renewable energy capacity by 2025. In FY 2022-23, investments in solar and wind energy projects reached approximately **₹1,000 crores**, contributing to OIL’s commitment to sustainable energy solutions.
Technological Advancements in Drilling
With ongoing investments in drilling technology, OIL has enhanced its operational efficiency. The implementation of **automated drilling systems** has improved drilling times by **25%** compared to traditional methods. The company also reported a **reduction in operational costs by 15%** in 2022 due to advancements in technology and operational practices.
Efficient Resource Management Programs
OIL has focused on efficient resource management to optimize its production. In FY 2022, the company recorded a **net profit of ₹3,663 crores**, with a **return on equity (ROE)** of **12.5%**, indicating strong cash generation from its star products. Their initiatives in resource management have allowed them to maintain a healthy cash flow while also investing back into the growth of their operations.
| Key Area | Details | Financial Data |
|---|---|---|
| Offshore Production Growth | Production increase from offshore fields | 3.40 million metric tons in FY 2022-23 |
| Renewable Energy Investments | Target capacity for renewable energy projects | 1,000 MW by 2025; Investments of ₹1,000 crores |
| Technological Advancements | Efficiency improvements in drilling | 25% reduction in drilling times, 15% decrease in operational costs |
| Resource Management | Optimization of production and cash flow | Net profit of ₹3,663 crores; ROE of 12.5% |
Oil India Limited’s strategic focus on offshore exploration, renewable energy, technological advancements, and efficient management positions it as a Star in the BCG Matrix, indicating strong potential for sustained growth within a competitive market environment.
Oil India Limited - BCG Matrix: Cash Cows
In the context of Oil India Limited, several segments exemplify the Cash Cow classification within the BCG Matrix. These segments maintain a high market share and provide substantial cash flow, despite operating in a mature market.
Mature Onshore Oil Fields
Oil India Limited has developed mature onshore oil fields that have shown significant productivity. For instance, as of March 2023, Oil India reported an average daily production of approximately 3.2 million barrels of oil equivalent (boe). The mature fields contribute to over 60% of the company's total output, providing a robust cash flow that is essential for the company's financial stability.
Established Gas Production Facilities
The company possesses well-established gas production facilities, crucial for meeting domestic energy demands. In the fiscal year ending March 2023, Oil India recorded a natural gas production of 4.6 billion cubic meters. These facilities have a utilization rate of around 85%, ensuring consistent cash generation.
Long-term Domestic Supply Contracts
Long-term contracts provide a steady revenue base, stabilizing cash flow. Oil India has secured contracts that span over 20 years, amounting to a total value exceeding INR 10,000 crores. These contracts cover a significant portion of the company's output, thereby enhancing its financial predictability.
Downstream Refining Operations
Oil India Limited's refining sector also serves as a Cash Cow, with refining capacity standing at around 7.0 million metric tons per annum (MTPA). The downstream segment reported a refining margin of approximately USD 10 per barrel in the most recent quarter, contributing significantly to the overall profitability. Below is a table reflecting key financial metrics from this segment:
| Refinery Name | Capacity (MTPA) | Utilization Rate (%) | Refining Margin (USD/barrel) | Quarterly Output (MT) |
|---|---|---|---|---|
| Numaligarh Refinery | 3.0 | 90 | 10 | 700,000 |
| Guwahati Refinery | 1.0 | 92 | 10.5 | 250,000 |
| Digboi Refinery | 0.5 | 85 | 9.5 | 125,000 |
| IOR (Integrated Oil Refinery) | 2.5 | 95 | 11 | 650,000 |
The numbers depicted demonstrate the strength of Oil India Limited's cash-generating capabilities through its core business segments. With a strong focus on efficiency and profitability, these Cash Cows continue to support both operational and investment strategies within the company.
Oil India Limited - BCG Matrix: Dogs
The Dogs category in the BCG Matrix represents segments of Oil India Limited that exhibit low growth and low market share, indicating a need for careful evaluation and potential divestiture. These units often tie up capital without generating significant returns. Below are the specific components categorized as Dogs.
Underperforming Oil Wells
Oil India Limited has a number of underperforming oil wells primarily located in less lucrative regions. These wells have shown a decline in extraction rates, with production falling below the expected thresholds. For instance, certain wells in the Assam region experienced a drop in output to approximately 200 barrels per day (BPD), down from around 400 BPD two years prior.
Non-Core Business Units
Some of Oil India’s non-core business units are classified as Dogs due to their inability to align with the company's primary focus on exploration and production. The non-core segments have contributed less than 5% of total revenue, while consuming about 15% of the operating expenses. These units are often sidelined, leading to concerns about their future viability.
Low-Yield Onshore Fields
The exploration and production from low-yield onshore fields continue to show low profitability. Fields such as those within the Gobindpur area yield around 30,000 barrels annually, which is significantly below the breakeven point of 80,000 barrels. This discrepancy results in a negative cash flow situation, exacerbating the financial burden on the company.
Aging Infrastructure
Aging infrastructure has become a critical issue for Oil India Limited, constraining operational efficiency and impacting production levels. About 60% of the existing oil rigs are over 25 years old and require extensive maintenance, with average repair costs reaching up to INR 5 crores per rig annually. This situation contributes to a rising cost base, further entrenching these units as Dogs in the BCG Matrix.
| Category | Details | Financial Impact |
|---|---|---|
| Underperforming Oil Wells | Average output of 200 BPD | Revenue loss of approximately INR 10 crores annually |
| Non-Core Business Units | Contribute 5% of total revenue | Expenses consuming INR 50 crores |
| Low-Yield Onshore Fields | Annual yield of 30,000 barrels | Negative cash flow; breakeven at 80,000 barrels |
| Aging Infrastructure | 60% of rigs over 25 years old | Annual maintenance cost of INR 5 crores per rig |
In summary, the Dogs category within Oil India Limited illustrates business units that are struggling in both market share and growth, necessitating strategic decisions regarding their future viability and financial impact on the company.
Oil India Limited - BCG Matrix: Question Marks
In the context of Oil India Limited, several projects align with the 'Question Marks' category of the BCG Matrix. These projects, while situated in high-growth environments, currently yield low market shares. Below is a detailed exploration of these initiatives.
New Geographical Expansion Projects
Oil India has expanded its operations into several new geographical markets. In fiscal year 2023, the company reported a focus on expanding its presence in regions such as Africa and Southeast Asia. This strategic move aims to cultivate a foothold in underpenetrated markets.
For instance, in 2022, Oil India signed an USD 150 million exploration deal in Namibia, targeting offshore oil reserves. As part of this initiative, the company aims to drill multiple exploratory wells over the next two years, with potential reserves estimated at 1 billion barrels based on seismic data.
Investment in Unconventional Resources
Oil India is actively investing in unconventional resources, such as shale gas and tight oil. In 2023, the company allocated approximately INR 2,000 crore (around USD 245 million) towards the exploration and development of shale gas reserves in the northeastern region of India. Current estimates suggest these reserves could yield up to 500 billion cubic feet over the next decade.
Emerging Market Ventures
Emerging market ventures are another focus area, with Oil India targeting renewable energy projects. The company announced plans to invest USD 100 million in solar and wind energy projects across India by 2025. This is crucial as the demand for renewable energy sources continues to grow, with expectations that India’s renewable energy market will reach USD 20 billion by 2025.
Furthermore, in 2023, Oil India entered into a partnership with a local firm in Brazil to develop biofuels, with an estimated investment of USD 50 million. The Brazilian biofuel market is projected to expand at a CAGR of 7% from 2023 to 2030, highlighting significant growth opportunities.
Partnerships with Tech Companies for Innovation
To enhance operational efficiencies and innovate product offerings, Oil India has pursued strategic partnerships with technology firms. In 2023, the company collaborated with Siemens AG to implement advanced digital solutions in its drilling operations. This partnership is projected to increase productivity by 15% and reduce operational costs.
Additionally, Oil India is also exploring digital twin technologies and AI-driven analytics with local startups, which could potentially lead to a cost reduction of 10% in overall operational expenditures. Initial funding for these initiatives was pegged at INR 500 crore (approximately USD 61 million).
| Initiative | Investment (USD) | Market Growth Potential | Expected Return (Years) |
|---|---|---|---|
| Geographical Expansion (Namibia) | 150 million | High | 5-7 |
| Unconventional Resources (Shale Gas) | 245 million | Medium-High | 8-10 |
| Renewable Energy Ventures | 100 million | High | 3-5 |
| Tech Partnerships | 61 million | Medium | 3-4 |
In summary, these initiatives underscore Oil India Limited's strategic approach to transforming its Question Marks into viable growth opportunities, although they currently face challenges in market share and profitability.
The BCG Matrix for Oil India Limited reveals a dynamic portfolio, with its 'Stars' driving innovation in offshore exploration and renewable energy, while 'Cash Cows' sustain cash flow through mature onshore operations. However, 'Dogs' highlight the challenges of underperforming assets, and 'Question Marks' present both the risks and opportunities in new ventures. This strategic analysis underscores the importance of agile management in navigating the complexities of the energy sector.
[right_small]Disclaimer
All information, articles, and product details provided on this website are for general informational and educational purposes only. We do not claim any ownership over, nor do we intend to infringe upon, any trademarks, copyrights, logos, brand names, or other intellectual property mentioned or depicted on this site. Such intellectual property remains the property of its respective owners, and any references here are made solely for identification or informational purposes, without implying any affiliation, endorsement, or partnership.
We make no representations or warranties, express or implied, regarding the accuracy, completeness, or suitability of any content or products presented. Nothing on this website should be construed as legal, tax, investment, financial, medical, or other professional advice. In addition, no part of this site—including articles or product references—constitutes a solicitation, recommendation, endorsement, advertisement, or offer to buy or sell any securities, franchises, or other financial instruments, particularly in jurisdictions where such activity would be unlawful.
All content is of a general nature and may not address the specific circumstances of any individual or entity. It is not a substitute for professional advice or services. Any actions you take based on the information provided here are strictly at your own risk. You accept full responsibility for any decisions or outcomes arising from your use of this website and agree to release us from any liability in connection with your use of, or reliance upon, the content or products found herein.