
|
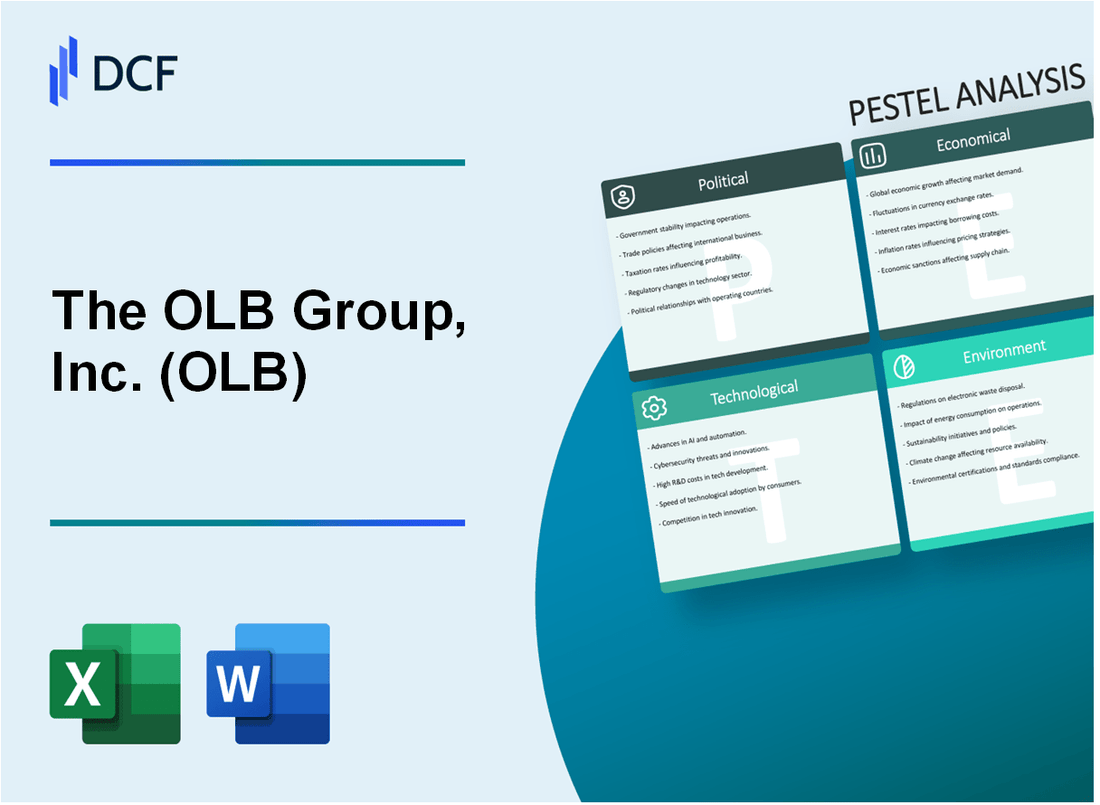
The OLB Group, Inc. (OLB): PESTLE Analysis [Nov-2025 Updated] |
Fully Editable: Tailor To Your Needs In Excel Or Sheets
Professional Design: Trusted, Industry-Standard Templates
Investor-Approved Valuation Models
MAC/PC Compatible, Fully Unlocked
No Expertise Is Needed; Easy To Follow
The OLB Group, Inc. (OLB) Bundle
The OLB Group, Inc. (OLB) is navigating 2025 with a strong defensive posture-zero debt as of June 30, 2025-but its small business clients are still facing bank loan rates between 6.6% and 11.5%. The real upside is the new pro-crypto clarity from the GENIUS Act and the unique market access to over 31,600 bodegas, which sets up a high-stakes play between economic reality and regulatory opportunity. Let's dig into the macro forces shaping OLB's path right now.
Political Factors: Regulatory Clarity and Tax Uncertainty
The political landscape is defintely shifting in favor of FinTechs with a crypto focus. We've seen a clear reduction in regulatory burden from the current US administration. The biggest win is the GENIUS Act, signed in July 2025, which finally establishes a clear federal framework for stablecoins. This clarity removes a huge overhang for OLB's OmniSoft platform, which processes cryptocurrencies like Bitcoin and USDC.
Still, there's fiscal uncertainty for OLB's small business clients. The potential expiration of the 2017 tax cuts could impact their cash flow, meaning less money for them to spend on payment services. Also, the new administration is focused on rolling back certain labor and overtime rules, which could slightly ease operating costs for the 31,600+ bodegas OLB serves.
Economic Factors: High Rates vs. Zero Debt
Honestly, the economic reality for OLB's merchant base is tough. The Federal funds effective rate is stubbornly high at 4.33% as of July 2025. This translates directly to high small business borrowing costs, with average bank loan rates sitting between 6.6% and 11.5%. High rates slow down capital investment for the very businesses OLB serves.
Plus, US inflation remains elevated at 2.9% as of August 2025. This increases the cost of goods and operations for merchants, squeezing their margins. The good news for OLB itself is its balance sheet strength: the company eliminated all outstanding debt as of June 30, 2025. This means OLB is insulated from the high-interest-rate environment that is punishing its clients.
Sociological Factors: Targeting the Underbanked
OLB's core strategy is smart because it targets the underbanked and underserved community for financial inclusion. The Moola Cloud service has deep penetration, serving a large network of over 31,600 bodegas and convenience stores. That's a massive, often overlooked, market segment.
The launch of the MOOLA Pay Mastercard prepaid card directly addresses the need of the unbanked market. This is a crucial move. Plus, consumer demand for digital and real-time payment options is growing across all demographics, so OLB's tech stack is well-positioned to capture that trend.
Technological Factors: Real-Time Payments and PayFac
The technology side is where OLB is making its best moves. Their new PayFac (Payment Facilitator) service offers rapid merchant onboarding and streamlines compliance, which is a huge benefit for small, time-strapped businesses. They've also implemented support for Real Time Payment (RTP) and Electronic Bill Pay, keeping them current with payment infrastructure.
Security is covered too. The platform integrates advanced fraud prevention like 3D Secure. Critically, the OmniSoft platform is future-proofed by processing multiple cryptocurrencies, including Bitcoin, Ethereum, and USDC. That's a clear pathway to capturing the digital asset transaction volume as it grows.
Legal Factors: Crypto Clarity and Corporate Spin-Off
The legal environment has become clearer, especially in crypto. The new GENIUS Act provides clear legal guidelines for stablecoin operations, which is a major de-risking event for the entire sector. Also, the SEC's rescission of SAB 121 (which was replaced by SAB 122) eases crypto custody rules for banks, potentially opening up more institutional partnerships down the line.
On the corporate side, the DMint spin-off requires final SEC effectiveness and Nasdaq clearance on its Form S-1. That's the near-term legal hurdle to watch. For their merchant clients, the PayFac service is doing the heavy lifting by managing complex regulatory and compliance burdens for SMBs (Small to Midsize Businesses). They handle the paperwork so the bodega owner doesn't have to.
Environmental Factors: Zero Carbon Mining Strategy
The Environmental factor is mainly driven by the DMint Bitcoin mining subsidiary. This is a key ESG (Environmental, Social, and Governance) risk area for any digital asset company, but DMint is mitigating it effectively by using zero carbon hydroelectric and solar power. That's a strong differentiator.
This sustainable energy focus directly addresses the increased investor scrutiny on the energy consumption of digital asset operations. The company operates a facility in Tennessee with a substantial 20-megawatt capacity, showing a concrete commitment to large-scale, sustainable mining. It's a smart way to manage a high-profile risk.
The OLB Group, Inc. (OLB) - PESTLE Analysis: Political factors
Pro-crypto US administration is reducing regulatory burden.
You need to know that the current US administration is actively creating a favorable, lower-friction environment for digital assets, which directly impacts The OLB Group, Inc.'s fintech and Bitcoin mining operations. The administration's policy, affirmed by an Executive Order on January 23, 2025, is to support, protect, and promote digital asset technologies, moving away from the prior era's 'regulation by enforcement.'
This shift is most visible at the Securities and Exchange Commission (SEC). On November 12, 2025, SEC Chairman Paul Atkins unveiled 'Project Crypto,' an initiative to replace regulatory ambiguity with a clear roadmap for the industry. This clarity is a game-changer for a company like OLB, which operates a Bitcoin mining subsidiary, DMint, and integrates crypto payment options into its merchant services. Less regulatory uncertainty means lower compliance costs and faster product development. It's defintely a tailwind for their digital commerce strategy.
GENIUS Act, signed July 2025, establishes a federal stablecoin framework.
The passage of the Guiding and Establishing National Innovation for US Stablecoins Act (GENIUS Act) on July 18, 2025, is perhaps the most significant political development for the payments sector. This law creates the first-ever federal regulatory framework for payment stablecoins, clarifying that they are not securities and must be 100% backed by liquid assets such as U.S. dollars or short-term Treasuries.
For OLB, which focuses on payment processing, this stablecoin clarity is a massive opportunity. It provides a reliable, federally-regulated digital dollar for its small and medium-sized business (SMB) clients, making crypto payments safer and more mainstream. This new framework could accelerate the adoption of digital payments on OLB's SecurePay and OmniSoft platforms, which processed a total payment volume of $2.58 billion in 2024. The table below summarizes the core requirements of the Act:
| GENIUS Act Key Requirement | Impact on OLB's Business Model |
|---|---|
| Reserve Backing | Requires 100% backing with U.S. dollars or Treasuries. |
| Regulatory Classification | Payment stablecoins are not classified as a security or commodity. |
| Compliance | Issuers are subject to the Bank Secrecy Act (BSA) and Anti-Money Laundering (AML) rules. |
Potential expiration of 2017 tax cuts creates fiscal uncertainty for small business clients.
The biggest near-term risk was the potential tax hike facing OLB's core clientele-SMBs-but this has largely been mitigated by late 2025 legislation. Many provisions of the 2017 Tax Cuts and Jobs Act (TCJA) were set to expire at the end of the 2025 fiscal year. The primary concern for small businesses was the sunset of the 20% deduction for Qualified Business Income (QBI) under Section 199A, which benefits sole proprietorships, partnerships, and S-corporations.
However, the administration addressed this uncertainty in July 2025 by signing the One Big Beautiful Bill Act, which made the QBI deduction permanent. This is a huge win for OLB's merchants, as it locks in lower tax liability and preserves capital for investment, potentially increasing their capacity to spend on OLB's services. The Act also made 100% bonus depreciation permanent for qualified property placed in service after January 19, 2025, encouraging capital expenditure. Here's the quick math: a permanent QBI deduction means a small business owner avoids a significant tax increase, freeing up cash flow to invest in their business, like upgrading to an OLB OmniSoft Point-of-Sale system.
New administration is focused on rolling back labor and overtime rules.
The Department of Labor (DOL) has signaled a clear focus on deregulation, which reduces the compliance burden for OLB's small business customers. In a major development, a federal court vacated a prior administration's rule that would have raised the minimum salary threshold for overtime-exempt employees to $58,656 annually as of January 1, 2025.
This ruling keeps the existing 2019 threshold of $35,568 in place. The DOL has since placed any further updates to the 'white collar' overtime exemption on the 'long term action' regulatory agenda, effectively halting an immediate, costly change. For OLB's merchant base, this regulatory stability and lower labor cost pressure is a positive factor:
- Reduces immediate labor cost hikes for small business clients.
- Keeps the overtime exemption salary threshold at $35,568 per year.
- Frees up management time that would have been spent on complex compliance changes.
This is a direct cost-saving measure for the small businesses that make up OLB's client base.
The OLB Group, Inc. (OLB) - PESTLE Analysis: Economic factors
Federal funds effective rate remains high at 4.33% as of July 2025.
The prevailing macroeconomic environment, shaped by the Federal Reserve's monetary policy, presents a clear headwind for the broader economy, even as The OLB Group, Inc. (OLB) has managed its own debt. The Federal Open Market Committee (FOMC) held its target range for the Federal Funds Rate (FFR) steady at 4.25% to 4.5% in July 2025. This is a high-rate environment, sustained since late 2024, designed to cool inflation.
For OLB, which provides payment processing and commerce solutions to small and medium-sized businesses, this high interest rate environment translates directly into a tighter credit market for its merchant customers. When borrowing money is expensive, businesses slow down capital expenditures and expansion, which can dampen the volume of transactions OLB processes. It's a classic squeeze on the merchant base.
Here is the quick math on the current rate environment:
- Current FFR Target Range: 4.25%-4.5% (as of July 2025)
- Impact on Merchant Clients: Higher cost of capital for business expansion or inventory financing.
- Monetary Policy Stance: The Fed remains focused on its dual mandate, noting that inflation is still somewhat elevated.
US inflation remains elevated at 2.9% as of August 2025, increasing merchant costs.
The US annual inflation rate, measured by the Consumer Price Index (CPI), accelerated to 2.9% in August 2025, ticking up from 2.7% in July. This elevated inflation, which is still above the Federal Reserve's long-term 2% target, is a double-edged sword for OLB's client base. On one hand, it means the nominal value of transactions processed by OLB might be slightly higher due to increased prices. On the other hand, it significantly increases the operating costs for the merchants themselves.
Higher costs for food (up 3.2% in August 2025), energy, and labor cut into merchant profit margins, making them more sensitive to payment processing fees. For a company like OLB, this means the competitive pressure to offer lower transaction costs or more value-added services rises sharply. If onboarding takes 14+ days, churn risk defintely rises.
OLB eliminated all outstanding debt as of June 30, 2025, strengthening its balance sheet.
In a powerful counter-move to the high-rate economic climate, OLB made a critical strategic decision. As of June 30, 2025, the Company successfully converted all outstanding notes, loans, and related-party debt into common equity. This action effectively reduced related liabilities to zero and eliminated future interest expense. This is a huge win for financial stability.
This debt elimination significantly strengthens the balance sheet, providing a buffer against economic uncertainty and freeing up cash flow that would otherwise service debt. For the six months ended June 30, 2025, OLB also reported a significant net loss improvement, decreasing to $3.21 million, an improvement of $1.84 million compared to the same period in 2024. The absence of debt interest payments is a key component of this operational improvement.
Small business borrowing costs are high, with average bank loan rates between 6.6% and 11.5%.
The elevated Federal Funds Rate translates directly into high borrowing costs for the small businesses that make up OLB's core merchant network. For a traditional bank loan, a small business can expect an Annual Percentage Rate (APR) ranging from 6.7% to 11.5% in late 2025. Median fixed-rate term loans are around 7.4%. This compares to even higher rates for online or alternative lenders, which can go up to 99% for riskier borrowers.
These high costs mean that merchants are less likely to invest in new point-of-sale (POS) systems, expand their physical footprint, or hire new staff, which slows the growth of transaction volume for OLB. The high cost of capital is the single biggest brake on small business growth right now.
| Metric (as of 2025) | Value/Range | Significance for OLB |
|---|---|---|
| Federal Funds Rate Target (July 2025) | 4.25% - 4.5% | High cost of capital for merchants and the broader economy. |
| US Annual Inflation Rate (August 2025) | 2.9% (CPI) | Increases merchant operating costs, driving demand for cost-efficient payment solutions. |
| OLB Outstanding Debt (June 30, 2025) | $0 (Eliminated) | Strengthens balance sheet, eliminates interest expense, and improves financial flexibility. |
| Average Small Business Bank Loan Rate (2025) | 6.7% - 11.5% | Restricts merchant expansion, potentially slowing OLB's transaction volume growth. |
The OLB Group, Inc. (OLB) - PESTLE Analysis: Social factors
Core strategy targets the underbanked and underserved community for financial inclusion.
The OLB Group, Inc.'s core strategy is sharply focused on financial inclusion, directly addressing the significant segment of the US population that is either unbanked or underbanked. This is a massive social opportunity, not just a niche market. The Federal Deposit Insurance Corporation (FDIC) reports that the underbanked population-households with a bank account but still relying on nonbank financial services-grew to approximately 14.2% of US households, or about 19 million households, in the most recent survey.
The unbanked population, those with no bank account at all, sits at 4.2%, representing roughly 5.6 million households. This demographic often faces higher fees and less security using alternative financial services like check cashers or money orders. The OLB Group, Inc. is positioning itself as a primary, trusted financial access point for these communities.
Here's the quick math on the target market size as of 2025:
| US Household Status (2025 Context) | Percentage of US Households | Approximate Number of Households |
|---|---|---|
| Underbanked (Bank account + Nonbank services) | 14.2% | ~19 million |
| Unbanked (No bank account) | 4.2% | ~5.6 million |
| Total Target Market for Financial Inclusion | 18.4% | ~24.6 million |
Moola Cloud serves a large network of 31,600+ bodegas and convenience stores.
The Moola Cloud platform's distribution model is a critical social factor, leveraging the existing trust and convenience of local neighborhood stores. As of the second quarter of 2025, Moola Cloud serves an extensive network of over 31,600+ bodega and convenience stores nationwide. This is a defintely smart move, because these local shops are often the de facto community hubs in urban and underserved areas where traditional bank branches are scarce.
This network size provides a massive, pre-established physical footprint for financial services distribution, overcoming a key barrier to entry for many fintech companies. The strategy turns a simple corner store into a 'Point of Banking' (POB) location, making financial services accessible 24/7, right where people live and shop.
Launch of MOOLA Pay Mastercard prepaid card addresses the unbanked market need.
The launch of the MOOLA Pay Mastercard prepaid card, scheduled for the First Quarter of 2025, directly addresses the need for a non-traditional banking product. This card is a crucial component of the financial inclusion strategy, offering a secure, regulated alternative to cash and high-fee services. The prepaid card market is already a primary financial tool for this segment.
The broader market data shows the reliance on these products: more than 48 million unbanked and underbanked Americans relied on prepaid cards as a primary financial tool in 2025. The MOOLA Pay card, distributed through the 31,600+ Moola Cloud locations, is designed to capture a significant share of this market by offering comprehensive features:
- Virtual wallet capabilities and peer-to-peer transfers.
- Remote paycheck deposits.
- Bill payments for over 30,000 utility companies.
- Cross-border payment functionality.
Growing consumer demand for digital and real-time payment options.
The social shift toward digital and real-time payments creates a strong tailwind for The OLB Group, Inc. Consumers, even in underbanked communities, expect faster, more convenient ways to handle money. Roughly 92% of U.S. consumers have used a digital payment method in the past year, showing how pervasive this trend is across all demographics.
This demand is driving the adoption of real-time payment (RTP) systems like FedNow. Globally, real-time transactions are projected to reach about 575 billion by 2028, reflecting a strong compound annual growth rate (CAGR) of 31.7% (by volume of transactions) between 2023 and 2028 in the US. The OLB Group, Inc.'s focus on digital offerings, combined with the physical network, positions it to capitalize on this social expectation for instant financial access, improving cash flow for both the merchant and the consumer.
The OLB Group, Inc. (OLB) - PESTLE Analysis: Technological factors
The technological environment presents a dual-edged sword for The OLB Group, Inc., driving innovation in payment acceptance while demanding significant capital investment to maintain security and speed. The company's strategic focus in 2025 is on integrated, cloud-based solutions that simplify complex financial operations for its small-to-medium-sized business (SMB) merchant base, which currently includes a network of over 31,600 bodega and convenience stores.
New PayFac service offers rapid merchant onboarding and streamlined compliance.
The launch of the new Payment Facilitator (PayFac) service in March 2025 is a critical technological upgrade designed to cut through the traditional friction of merchant account setup. This service allows small businesses to begin accepting payments immediately, with a rapid onboarding process that significantly reduces the waiting period to a matter of hours.
This streamlined approach is a core competitive advantage, translating the complex regulatory and technical requirements of payment processing into a simple, integrated solution for the merchant. By managing compliance on behalf of its clients, OLB Group enables merchants to focus on operations, a vital feature given the company's focus on the high-volume, low-margin convenience store market. This is a defintely a smart move for market share growth.
Platform integrates advanced fraud prevention like 3D Secure.
Security technology remains paramount, especially with the rise of Card-Not-Present (CNP) fraud. In January 2025, the company's SecurePay Gateway launched 3D Secure (3DS) access control, a key technological defense against this risk. This advanced protocol, integrated with major card networks like Visa and Mastercard, adds an authentication layer for online transactions, directly reducing the merchant's exposure to fraud-related chargebacks.
The integration of such enterprise-level security features is essential for maintaining trust and protecting the gross transaction volume, which was reported at $1.36 billion from 10,300 merchants in a prior period, demonstrating the scale of transactions requiring this protection. The goal is to make security seamless, not a hurdle.
Support for Real Time Payment (RTP) and Electronic Bill Pay is implemented.
The implementation of Real Time Payment (RTP) and Electronic Bill Pay capabilities is a forward-looking technological step, aligning OLB Group with the broader industry shift toward instant settlement. The company's 2025 outlook included 'Setting up RTP (Real Time Payments)' and 'Implementing Bill Payments,' highlighting these as strategic priorities for the year.
RTP allows funds to move instantly and securely between bank accounts 24/7/365, which is a game-changer for merchant cash flow and working capital management. This capability is integrated into the new PayFac service, offering comprehensive payment options to meet diverse customer preferences. The global RTP market is projected to surpass $41.6 billion in 2025, underscoring the massive opportunity this technology unlocks for OLB Group.
Here's the quick math on the importance of these payment rails:
| Payment Technology | Strategic Benefit for Merchants | Market Context (2025) |
|---|---|---|
| PayFac Service | Accelerated revenue start (onboarding in a matter of hours) | Addresses complexity for 31,600+ SMBs |
| 3D Secure (3DS) | Reduced CNP fraud and chargeback liability | Launched Q1 2025 for SecurePay Gateway |
| Real Time Payment (RTP) | Instant settlement, improving cash flow predictability | Global RTP market valued at over $41.6 billion |
OmniSoft platform processes multiple cryptocurrencies, including Bitcoin, Ethereum, and USDC.
The OmniSoft platform's long-standing ability to process multiple cryptocurrencies positions OLB Group at the intersection of traditional finance and digital assets. The platform supports transactions in major digital currencies, specifically Bitcoin, Ethereum, and the stablecoin USDC, among others. This feature is available across all merchant platforms-online, mobile, and in-store-through point-of-sale (POS) options.
This technological capability is crucial for attracting a forward-thinking merchant base and catering to customers who prefer using digital wallets like MetaMask™ or Coinbase Wallet™. The platform handles the conversion of cryptocurrency to U.S. dollars, shielding the merchant from the volatility of the crypto market while still offering a cutting-edge payment option. This is a clear differentiator in the competitive payments landscape, especially as the company navigates its financial position, having reported a year-to-date net loss of $4.39 million on revenue of $6.90 million as of September 30, 2025.
- Process Bitcoin, Ethereum, USDC, and DAI.
- Support transactions from major wallets (MetaMask™, Coinbase Wallet™).
- Automate conversion to fiat currency (U.S. dollars).
This crypto-commerce readiness is a strategic technology bet on future payment trends.
The OLB Group, Inc. (OLB) - PESTLE Analysis: Legal factors
For a FinTech company like The OLB Group, Inc., the legal landscape is not just a compliance checklist; it's a competitive differentiator, especially in the volatile crypto and payments sectors. The near-term legal environment in 2025 presents both clear paths and ongoing regulatory hurdles, demanding a defintely proactive strategy.
DMint spin-off requires final SEC effectiveness and Nasdaq clearance (Form S-1)
The planned spin-off of DMint, the Bitcoin mining subsidiary, remains a critical legal and corporate action that will reshape OLB's structure. As of August 2025, the process is still pending final approval. The company refiled its Form S-1 Registration Statement with the SEC, including updated Q2 2025 financials, to move toward effectiveness. This is a necessary step to satisfy the SEC's disclosure requirements for the new public entity.
The completion of the spin-off is contingent on two key regulatory milestones:
- SEC declaring the Form S-1 effective.
- Nasdaq granting clearance for the new DMint shares to list.
Once cleared, the company will set a record date for the distribution, providing OLB shareholders with a pro rata dividend of DMint shares. This separation is intended to provide shareholders with direct exposure to the cryptocurrency mining sector, while simplifying the parent company's core FinTech focus.
The new GENIUS Act provides clear legal guidelines for stablecoin operations
The legal clarity provided by the new federal stablecoin legislation, the Guiding and Establishing National Innovation for US Stablecoins Act (GENIUS Act), is a major positive for OLB's digital asset strategy. Signed into law on July 18, 2025, this Act establishes a clear framework that defines payment stablecoins-digital assets pegged to a fixed monetary value-as not being securities. This removes a significant regulatory cloud that had previously hung over the entire crypto-payments industry.
The GENIUS Act's core requirements create a new standard for legitimacy and trust:
- Mandates 100% backing of stablecoins by highly liquid assets like US dollars or short-term Treasury securities.
- Requires issuers to comply with the Bank Secrecy Act (BSA) for Anti-Money Laundering (AML) and Know Your Customer (KYC) compliance.
- Creates a path for both banks and federally licensed non-bank institutions to issue stablecoins under clear supervision.
This clear regulatory rulebook is a tailwind, making it easier for OLB to integrate stablecoin payments into its merchant services platform with less legal ambiguity.
SEC's rescission of SAB 121 (replaced by SAB 122) eases crypto custody for banks
The SEC's issuance of Staff Accounting Bulletin (SAB) 122 on January 23, 2025, which rescinded the prior guidance in SAB 121, represents a significant regulatory easing that benefits the entire crypto ecosystem, including FinTech providers like OLB. SAB 121 had controversially required banks to record client crypto assets held in custody as a liability on their balance sheets. This made it prohibitively expensive for regulated financial institutions to offer crypto custody services.
The shift under SAB 122 means institutions now apply existing accounting standards for loss contingencies, rather than recording the full value of the assets as a liability. Here's the quick math on the impact:
| Accounting Standard | Requirement for Custodied Crypto Assets | Impact on Bank Balance Sheets |
|---|---|---|
| SAB 121 (Rescinded) | Recognize the full fair value of client assets as a liability. | Made crypto custody capital-intensive and impractical for most banks. |
| SAB 122 (Effective 2025) | Apply existing loss contingency standards (ASC 450). | Removes the full liability requirement, easing bank entry into the crypto custody market. |
This change encourages more regulated banks to enter the digital asset custody space, which increases the stability and legitimacy of the financial infrastructure that OLB's crypto-enabled services rely upon.
The PayFac service manages complex regulatory and compliance burdens for SMBs
OLB operates as a Payment Facilitator (PayFac), a model that legally and operationally absorbs the complex regulatory burden for its merchant clients. The company's PayFac service, particularly through its Moola Cloud platform, is designed to handle the ongoing compliance requirements of the payments industry, like PCI DSS (Payment Card Industry Data Security Standard) and Anti-Money Laundering (AML) rules, for small and medium-sized businesses (SMBs).
This service is crucial in a year like 2025, which saw the Federal Reserve's Fedwire system transition to the ISO 20022 messaging standard on July 14, 2025, demanding significant back-end system updates for payment processors. By taking on the compliance role, OLB allows its merchant network-which stood at over 31,600+ bodega and convenience stores nationwide as of June 30, 2025-to focus on sales instead of regulatory paperwork.
The efficiency of this centralized compliance management is reflected in the company's financials; for the six months ended June 30, 2025, OLB reported a reduction in Processing and servicing costs by $1.95 million, a 34% decrease year-over-year. This cost reduction is a direct benefit of streamlining operations, including compliance and risk management, across a large merchant base.
The OLB Group, Inc. (OLB) - PESTLE Analysis: Environmental factors
DMint's Zero-Carbon Energy Strategy
You're looking at The OLB Group, Inc. (OLB) and its Bitcoin mining subsidiary, DMint, and the environmental picture is clearer than for most crypto operations. DMint's core strategy is to use zero-carbon energy sources for its mining facility in Selmer, Tennessee. This isn't just a marketing slogan; it's a critical operational choice that maps directly to lower costs and lower regulatory risk.
The facility utilizes sustainable hydroelectric and solar power to run its mining operations. This approach is a direct counter to the industry's historical reliance on carbon-intensive energy, which has been a major sticking point for institutional investors. Honestly, in the digital asset space, your energy source is now a balance sheet item.
Mitigating ESG Risk Through Sustainable Power
This sustainable energy focus defintely mitigates a key Environmental, Social, and Governance (ESG) risk that plagues the broader digital asset sector. By leveraging low-cost, zero-carbon power, DMint positions itself favorably against competitors who face escalating scrutiny over their carbon footprint. This is a smart move because it translates directly into a more resilient business model, especially as regulatory bodies and institutional capital prioritize climate-related disclosures.
Here's the quick math on DMint's operational advantage in Selmer, TN:
- Facility Location: Selmer, TN
- Primary Power Source: TVA hydroelectric power
- Reported Power Cost: Under $0.048/Kwh
- Total Facility Capacity: 20 Megawatts (MW)
Increased Investor Scrutiny on Digital Asset Energy Use
The market environment in 2025 shows increased investor scrutiny on the energy consumption of digital asset operations. Bitcoin miners are facing rising energy costs and regulatory pressure, driving a flight to quality for firms with demonstrably lower environmental impact. DMint's structure is designed to capitalize on this trend.
To be fair, the entire industry is navigating a complex landscape where ESG principles are becoming non-negotiable for large-scale capital. DMint's low power cost-under $0.048/Kwh-is a key differentiator, especially when considering that miners with power costs under $0.054/Kwh are generally seen as best positioned to survive market pressures like the recent Bitcoin halving.
Tennessee Facility Capacity and Operational Metrics
The company operates a dedicated Bitcoin mining facility in Selmer, Tennessee, which provides a concrete scale for its green operations. The facility's total capacity is a significant 20 Megawatts (MW). This capacity is capable of powering up to 5,000 mining machines, which gives OLB a clear path to scale its mining revenue while maintaining its low-carbon profile.
What this estimate hides is the operational uptime and the actual number of miners running at any given time, but the potential is clear. The key takeaway is the low-cost, sustainable infrastructure is already built, which is a massive barrier to entry for competitors.
| DMint Facility Metric (2025 Fiscal Year Data) | Value | Significance |
|---|---|---|
| Facility Location | Selmer, TN | Proximity to TVA hydroelectric power. |
| Total Power Capacity | 20 Megawatts (MW) | Scale of operation for the Bitcoin mining subsidiary. |
| Maximum Miner Capacity | 5,000 mining machines | Directly correlates to potential hash rate and revenue. |
| Reported Power Cost | Under $0.048/Kwh | Highly competitive rate, crucial for profitability post-halving. |
| Primary Energy Type | Sustainable Hydroelectric and Solar | Mitigates key ESG and carbon-intensity risk. |
Disclaimer
All information, articles, and product details provided on this website are for general informational and educational purposes only. We do not claim any ownership over, nor do we intend to infringe upon, any trademarks, copyrights, logos, brand names, or other intellectual property mentioned or depicted on this site. Such intellectual property remains the property of its respective owners, and any references here are made solely for identification or informational purposes, without implying any affiliation, endorsement, or partnership.
We make no representations or warranties, express or implied, regarding the accuracy, completeness, or suitability of any content or products presented. Nothing on this website should be construed as legal, tax, investment, financial, medical, or other professional advice. In addition, no part of this site—including articles or product references—constitutes a solicitation, recommendation, endorsement, advertisement, or offer to buy or sell any securities, franchises, or other financial instruments, particularly in jurisdictions where such activity would be unlawful.
All content is of a general nature and may not address the specific circumstances of any individual or entity. It is not a substitute for professional advice or services. Any actions you take based on the information provided here are strictly at your own risk. You accept full responsibility for any decisions or outcomes arising from your use of this website and agree to release us from any liability in connection with your use of, or reliance upon, the content or products found herein.