|
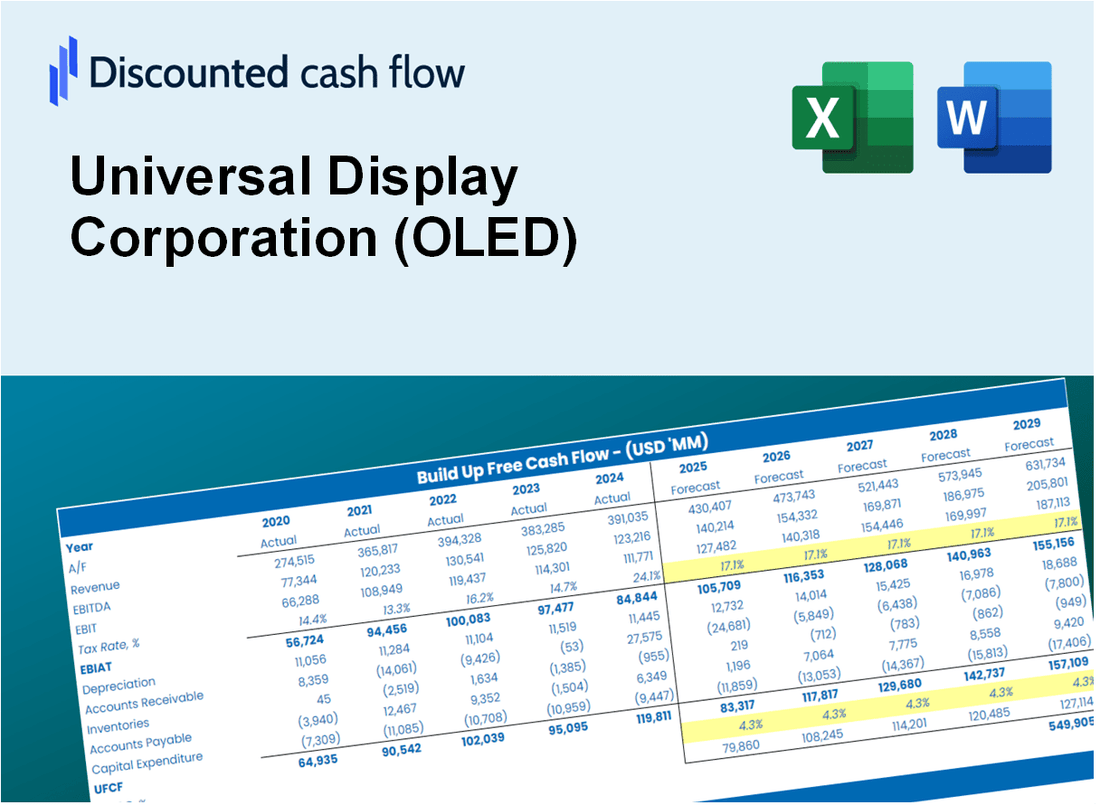
Universal Display Corporation (OLED) DCF Valuation |
Fully Editable: Tailor To Your Needs In Excel Or Sheets
Professional Design: Trusted, Industry-Standard Templates
Investor-Approved Valuation Models
MAC/PC Compatible, Fully Unlocked
No Expertise Is Needed; Easy To Follow
Universal Display Corporation (OLED) Bundle
Enhance your investment strategies with the (OLED) DCF Calculator! Utilize real Universal Display Corporation financial data, adjust growth projections and expenses, and instantly observe how these alterations affect the intrinsic value of (OLED).
What You Will Get
- Real OLED Financial Data: Pre-filled with Universal Display Corporation’s historical and projected data for precise analysis.
- Fully Editable Template: Modify key inputs like revenue growth, WACC, and EBITDA % with ease.
- Automatic Calculations: See Universal Display Corporation’s intrinsic value update instantly based on your changes.
- Professional Valuation Tool: Designed for investors, analysts, and consultants seeking accurate DCF results.
- User-Friendly Design: Simple structure and clear instructions for all experience levels.
Key Features
- Pre-Loaded Data: Universal Display Corporation’s historical financial statements and pre-filled forecasts.
- Fully Adjustable Inputs: Edit WACC, tax rates, revenue growth, and EBITDA margins.
- Instant Results: See Universal Display Corporation’s intrinsic value recalculate in real time.
- Clear Visual Outputs: Dashboard charts display valuation results and key metrics.
- Built for Accuracy: A professional tool for analysts, investors, and finance experts.
How It Works
- Step 1: Download the prebuilt Excel template featuring Universal Display Corporation’s (OLED) data.
- Step 2: Review the pre-filled sheets to familiarize yourself with the essential metrics.
- Step 3: Modify forecasts and assumptions in the editable yellow cells (WACC, growth, margins).
- Step 4: Instantly see the recalculated results, including Universal Display Corporation’s (OLED) intrinsic value.
- Step 5: Make well-informed investment choices or create reports based on the outputs.
Why Choose Universal Display Corporation (OLED)?
- Innovative Technology: Pioneers in OLED technology, leading the way in display solutions.
- Proven Performance: Established track record of delivering high-quality products and services.
- Sustainable Practices: Committed to environmentally friendly processes and materials.
- Expert Support: Access to a knowledgeable team dedicated to customer success.
- Industry Recognition: Highly regarded by peers and analysts for excellence in the field.
Who Should Use This Product?
- Finance Students: Explore valuation methods and apply them with real-time data for Universal Display Corporation (OLED).
- Academics: Integrate advanced financial models into your research or teaching materials.
- Investors: Validate your investment strategies and assess valuation scenarios for Universal Display Corporation (OLED).
- Analysts: Enhance your analysis process with a customizable DCF model tailored for Universal Display Corporation (OLED).
- Small Business Owners: Understand the valuation techniques used for large corporations like Universal Display Corporation (OLED).
What the Template Contains
- Preloaded OLED Data: Historical and projected financial data, including revenue, EBIT, and capital expenditures.
- DCF and WACC Models: Professional-grade sheets for calculating intrinsic value and Weighted Average Cost of Capital.
- Editable Inputs: Yellow-highlighted cells for adjusting revenue growth, tax rates, and discount rates.
- Financial Statements: Comprehensive annual and quarterly financials for deeper analysis.
- Key Ratios: Profitability, leverage, and efficiency ratios to evaluate performance.
- Dashboard and Charts: Visual summaries of valuation outcomes and assumptions.
Disclaimer
All information, articles, and product details provided on this website are for general informational and educational purposes only. We do not claim any ownership over, nor do we intend to infringe upon, any trademarks, copyrights, logos, brand names, or other intellectual property mentioned or depicted on this site. Such intellectual property remains the property of its respective owners, and any references here are made solely for identification or informational purposes, without implying any affiliation, endorsement, or partnership.
We make no representations or warranties, express or implied, regarding the accuracy, completeness, or suitability of any content or products presented. Nothing on this website should be construed as legal, tax, investment, financial, medical, or other professional advice. In addition, no part of this site—including articles or product references—constitutes a solicitation, recommendation, endorsement, advertisement, or offer to buy or sell any securities, franchises, or other financial instruments, particularly in jurisdictions where such activity would be unlawful.
All content is of a general nature and may not address the specific circumstances of any individual or entity. It is not a substitute for professional advice or services. Any actions you take based on the information provided here are strictly at your own risk. You accept full responsibility for any decisions or outcomes arising from your use of this website and agree to release us from any liability in connection with your use of, or reliance upon, the content or products found herein.