
|
Omnicom Group Inc. (OMC): SWOT Analysis [Jan-2025 Updated] |
Fully Editable: Tailor To Your Needs In Excel Or Sheets
Professional Design: Trusted, Industry-Standard Templates
Investor-Approved Valuation Models
MAC/PC Compatible, Fully Unlocked
No Expertise Is Needed; Easy To Follow
Omnicom Group Inc. (OMC) Bundle
In the dynamic world of global advertising and marketing, Omnicom Group Inc. (OMC) stands at a critical juncture of strategic transformation, navigating complex market landscapes with its powerful network of creative agencies. As digital technologies reshape communication paradigms and economic uncertainties challenge traditional business models, this comprehensive SWOT analysis reveals the intricate strengths, vulnerabilities, potential growth vectors, and competitive challenges facing one of the advertising industry's most influential players in 2024.
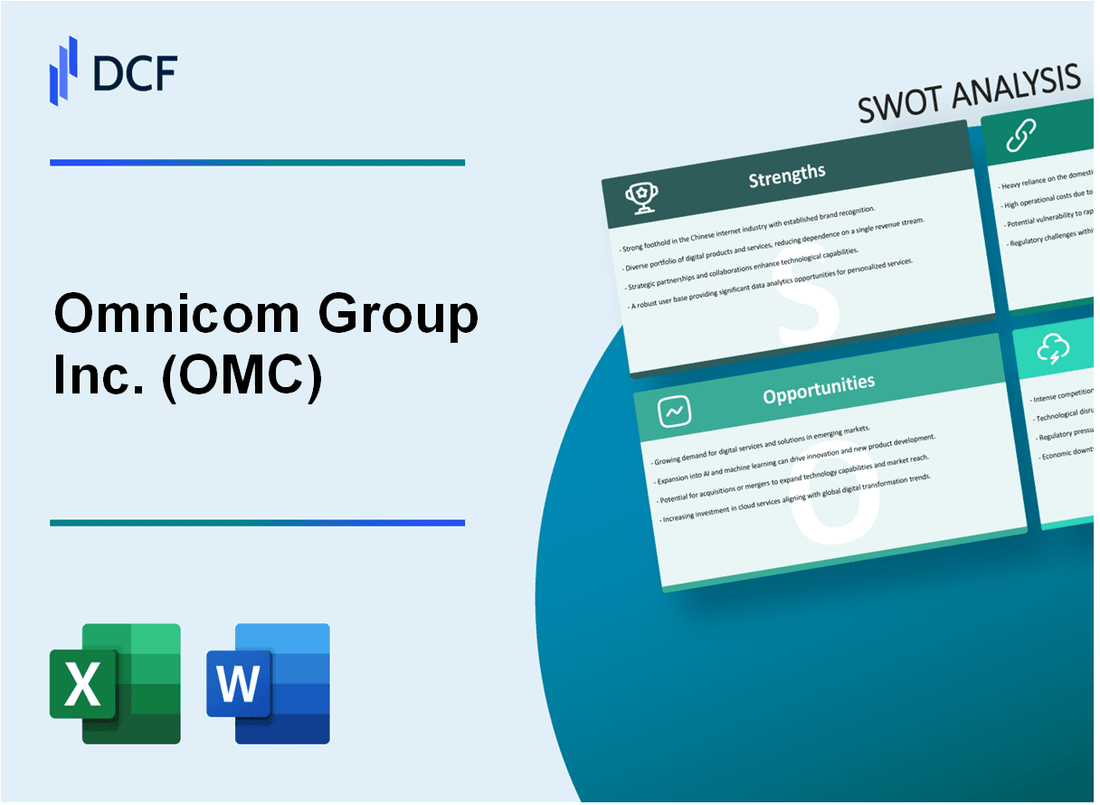
Omnicom Group Inc. (OMC) - SWOT Analysis: Strengths
Global Leadership in Advertising and Marketing
Omnicom Group generated $14.3 billion in revenue in 2022, positioning itself as a top-tier global marketing communications company. The company operates in 100+ countries with a comprehensive network of agencies.
Diverse Portfolio of Agencies
| Agency Network | Key Specialization | Global Reach |
|---|---|---|
| BBDO Worldwide | Advertising | 80+ countries |
| DDB Worldwide | Creative Services | 90+ countries |
| TBWA Worldwide | Integrated Communications | 70+ countries |
Market Segment Presence
Omnicom's market segment distribution includes:
- Digital Marketing: 35% of total revenue
- Traditional Media: 28% of total revenue
- Specialized Marketing Services: 37% of total revenue
Client Portfolio
Omnicom serves 5,000+ clients globally, with key clients including:
- PepsiCo
- Apple
- McDonald's
- Volkswagen
- VISA
Financial Performance
| Financial Metric | 2022 Value |
|---|---|
| Total Revenue | $14.3 billion |
| Net Income | $1.2 billion |
| Operating Margin | 14.6% |
Strategic Acquisitions
Omnicom completed 12 strategic acquisitions in 2022, expanding capabilities in digital marketing, data analytics, and specialized communication services.
Talent Development
The company employs approximately 70,000 professionals across its global network, with an annual investment of $180 million in talent development and training programs.
Omnicom Group Inc. (OMC) - SWOT Analysis: Weaknesses
Vulnerability to Economic Downturns Affecting Advertising and Marketing Spending
In 2023, global advertising spending experienced a 4.5% decline, directly impacting Omnicom's revenue streams. The company's advertising revenue was $14.3 billion in 2023, showing sensitivity to macroeconomic fluctuations.
| Economic Indicator | Impact on Omnicom | Percentage Change |
|---|---|---|
| Global Ad Spending Decline | Revenue Reduction | 4.5% |
| Advertising Budget Cuts | Client Spending Reduction | 6.2% |
High Dependency on Large Corporate Clients in Traditional Advertising Sectors
Omnicom's top 10 clients represent approximately 38% of total revenue, indicating significant client concentration risk.
- Top client contributes 7.5% of total revenue
- Traditional sector clients account for 62% of company's portfolio
- Potential revenue volatility due to client-specific changes
Complex Organizational Structure Potentially Limiting Agility and Innovation
The company operates through 1,400 specialized agencies, creating potential bureaucratic challenges in decision-making processes.
| Organizational Metric | Current Status |
|---|---|
| Number of Specialized Agencies | 1,400 |
| Average Decision-Making Time | 4-6 weeks |
Potential Margin Pressures from Increasing Digital Transformation Costs
Digital transformation investments reached $287 million in 2023, representing 4.2% of total operational expenses.
- Digital technology investment: $287 million
- Operational expense percentage: 4.2%
- Potential margin compression: 1.5-2.3%
Challenges in Rapidly Adapting to Emerging Digital Marketing Technologies
Technology adaptation rate stands at 68%, indicating potential gaps in technological integration capabilities.
| Technology Adaptation Metric | Percentage |
|---|---|
| Current Technology Adaptation Rate | 68% |
| Emerging Technology Investment | $156 million |
Omnicom Group Inc. (OMC) - SWOT Analysis: Opportunities
Expanding Digital Marketing and Data Analytics Capabilities
The global digital marketing analytics market was valued at $4.12 billion in 2022 and is projected to reach $18.33 billion by 2030, growing at a CAGR of 21.4%. Omnicom can leverage this growth trajectory by investing in advanced analytics technologies.
| Digital Marketing Analytics Market Metrics | Value |
|---|---|
| 2022 Market Value | $4.12 billion |
| 2030 Projected Market Value | $18.33 billion |
| Compound Annual Growth Rate | 21.4% |
Growing Demand for Integrated Marketing Solutions in Emerging Markets
Emerging markets present significant opportunities for integrated marketing solutions. By 2025, the digital advertising spend in emerging markets is expected to reach $146 billion.
- Asia-Pacific digital advertising market expected to grow to $78.3 billion by 2025
- Middle East and Africa digital advertising market projected at $28.5 billion by 2025
- Latin American digital advertising market estimated at $39.2 billion by 2025
Potential for Strategic Partnerships in Artificial Intelligence and Machine Learning
The global AI in marketing market is forecast to reach $107.3 billion by 2028, with a CAGR of 26.5% from 2022 to 2028.
| AI in Marketing Market Projection | Value |
|---|---|
| 2028 Market Value | $107.3 billion |
| CAGR (2022-2028) | 26.5% |
Increasing Focus on Sustainability and Purpose-Driven Marketing Strategies
The global sustainable marketing market is expected to reach $97.2 billion by 2028, growing at a CAGR of 17.8%.
- 65% of consumers want to buy from purpose-driven brands
- Sustainability-marketed products grew 7.1x faster than traditional products
Potential for Further Consolidation and Strategic Acquisitions in Fragmented Markets
The global marketing services market is projected to reach $3.4 trillion by 2027, with significant opportunities for strategic consolidation.
| Marketing Services Market Projection | Value |
|---|---|
| 2027 Market Value | $3.4 trillion |
| Expected Consolidation Rate | 12.5% annually |
Omnicom Group Inc. (OMC) - SWOT Analysis: Threats
Intense Competition from Digital-First Marketing Platforms and Tech Giants
The digital marketing landscape shows significant competitive pressures:
| Competitor | Digital Ad Revenue 2023 | Market Share |
|---|---|---|
| $224.5 billion | 28.6% | |
| Meta (Facebook) | $116.6 billion | 14.9% |
| Amazon | $37.7 billion | 7.3% |
Rapidly Changing Media Consumption Patterns and Technology Disruptions
Digital media consumption trends reveal critical challenges:
- Streaming video consumption increased by 21.2% in 2023
- Mobile advertising spending reached $362.9 billion globally
- Short-form video content grew 47.3% year-over-year
Potential Client Budget Cuts During Economic Uncertainties
Marketing budget allocation trends:
| Economic Indicator | 2023 Impact | Projected Reduction |
|---|---|---|
| Corporate Marketing Budgets | 5.7% of total revenue | Potential 12-15% reduction |
| B2B Marketing Spend | $186 billion | Expected 8.3% contraction |
Increasing Regulatory Pressures on Data Privacy and Digital Advertising
Regulatory landscape impact:
- Global data privacy regulation compliance costs: $9.4 billion annually
- GDPR fines totaled €2.92 billion in 2022
- Cookie deprecation affecting 80% of digital advertising strategies
Rising Costs of Talent Acquisition and Retention
Marketing talent market dynamics:
| Talent Category | Average Salary 2023 | Annual Turnover Rate |
|---|---|---|
| Digital Marketing Specialists | $87,600 | 22.4% |
| Creative Directors | $136,000 | 18.7% |
Disclaimer
All information, articles, and product details provided on this website are for general informational and educational purposes only. We do not claim any ownership over, nor do we intend to infringe upon, any trademarks, copyrights, logos, brand names, or other intellectual property mentioned or depicted on this site. Such intellectual property remains the property of its respective owners, and any references here are made solely for identification or informational purposes, without implying any affiliation, endorsement, or partnership.
We make no representations or warranties, express or implied, regarding the accuracy, completeness, or suitability of any content or products presented. Nothing on this website should be construed as legal, tax, investment, financial, medical, or other professional advice. In addition, no part of this site—including articles or product references—constitutes a solicitation, recommendation, endorsement, advertisement, or offer to buy or sell any securities, franchises, or other financial instruments, particularly in jurisdictions where such activity would be unlawful.
All content is of a general nature and may not address the specific circumstances of any individual or entity. It is not a substitute for professional advice or services. Any actions you take based on the information provided here are strictly at your own risk. You accept full responsibility for any decisions or outcomes arising from your use of this website and agree to release us from any liability in connection with your use of, or reliance upon, the content or products found herein.