
|
Ooma, Inc. (OOMA) DCF Valuation |
Fully Editable: Tailor To Your Needs In Excel Or Sheets
Professional Design: Trusted, Industry-Standard Templates
Investor-Approved Valuation Models
MAC/PC Compatible, Fully Unlocked
No Expertise Is Needed; Easy To Follow
Ooma, Inc. (OOMA) Bundle
Evaluate Ooma, Inc.'s financial prospects like an expert! This (OOMA) DCF Calculator provides pre-filled financial data while allowing you the flexibility to modify revenue growth, WACC, margins, and other crucial assumptions to align with your projections.
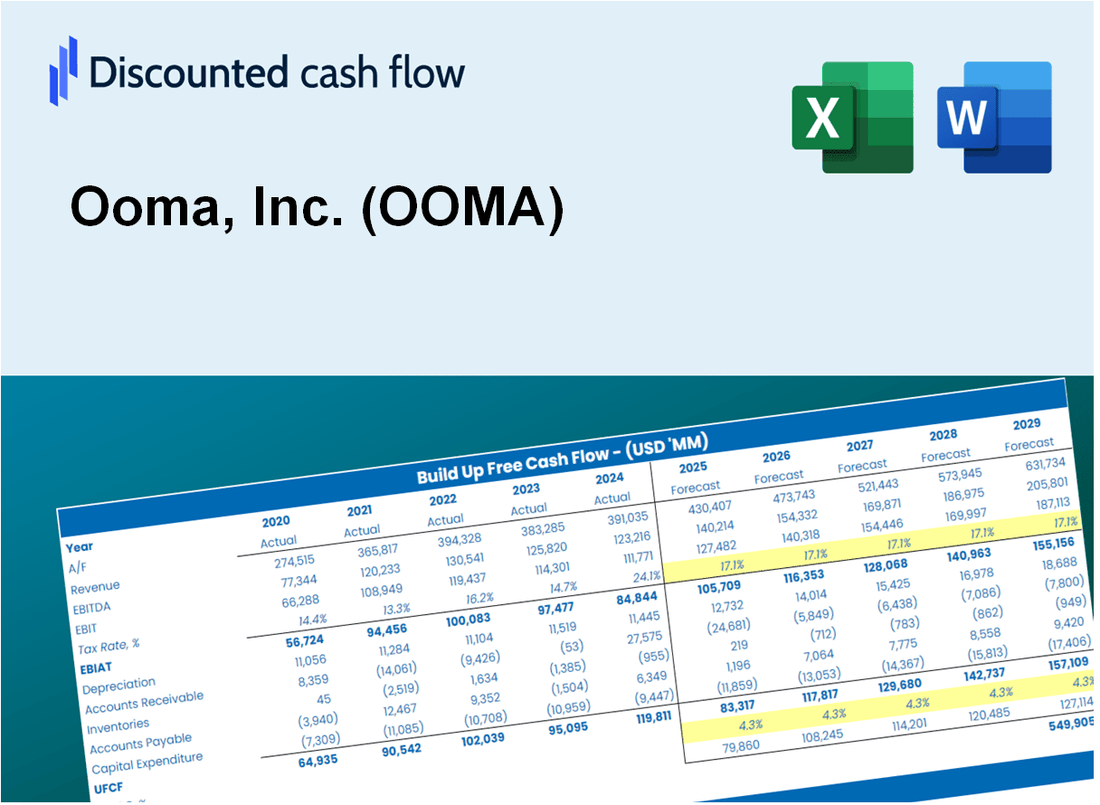
Discounted Cash Flow (DCF) - (USD MM)
| Year | AY1 2021 |
AY2 2022 |
AY3 2023 |
AY4 2024 |
AY5 2025 |
FY1 2026 |
FY2 2027 |
FY3 2028 |
FY4 2029 |
FY5 2030 |
|---|---|---|---|---|---|---|---|---|---|---|
| Revenue | 168.9 | 192.3 | 216.2 | 236.7 | 256.9 | 285.3 | 316.8 | 351.9 | 390.8 | 434.0 |
| Revenue Growth, % | 0 | 13.82 | 12.42 | 9.52 | 8.5 | 11.06 | 11.06 | 11.06 | 11.06 | 11.06 |
| EBITDA | 4.6 | 5.4 | 3.3 | 8.2 | 6.2 | 7.4 | 8.2 | 9.1 | 10.1 | 11.2 |
| EBITDA, % | 2.73 | 2.82 | 1.52 | 3.46 | 2.41 | 2.59 | 2.59 | 2.59 | 2.59 | 2.59 |
| Depreciation | 7.4 | 7.4 | 9.0 | 11.0 | 13.1 | 12.6 | 14.0 | 15.6 | 17.3 | 19.2 |
| Depreciation, % | 4.37 | 3.83 | 4.18 | 4.64 | 5.11 | 4.43 | 4.43 | 4.43 | 4.43 | 4.43 |
| EBIT | -2.8 | -1.9 | -5.8 | -2.8 | -6.9 | -5.2 | -5.8 | -6.5 | -7.2 | -8.0 |
| EBIT, % | -1.64 | -1 | -2.66 | -1.19 | -2.7 | -1.84 | -1.84 | -1.84 | -1.84 | -1.84 |
| Total Cash | 28.3 | 31.3 | 26.9 | 17.5 | 17.9 | 34.1 | 37.9 | 42.1 | 46.7 | 51.9 |
| Total Cash, percent | .0 | .0 | .0 | .0 | .0 | .0 | .0 | .0 | .0 | .0 |
| Account Receivables | 5.2 | 7.3 | 7.1 | 12.1 | 8.0 | 10.5 | 11.7 | 13.0 | 14.4 | 16.0 |
| Account Receivables, % | 3.09 | 3.8 | 3.3 | 5.12 | 3.13 | 3.69 | 3.69 | 3.69 | 3.69 | 3.69 |
| Inventories | 12.2 | 13.8 | 26.2 | 19.8 | 13.1 | 22.8 | 25.4 | 28.2 | 31.3 | 34.7 |
| Inventories, % | 7.24 | 7.2 | 12.14 | 8.36 | 5.09 | 8 | 8 | 8 | 8 | 8 |
| Accounts Payable | 7.5 | 7.5 | 13.5 | 7.8 | 6.0 | 11.5 | 12.8 | 14.2 | 15.8 | 17.6 |
| Accounts Payable, % | 4.44 | 3.9 | 6.23 | 3.32 | 2.34 | 4.04 | 4.04 | 4.04 | 4.04 | 4.04 |
| Capital Expenditure | -3.2 | -4.2 | -5.2 | -6.2 | -6.4 | -6.6 | -7.3 | -8.1 | -9.0 | -10.1 |
| Capital Expenditure, % | -1.87 | -2.19 | -2.41 | -2.6 | -2.51 | -2.32 | -2.32 | -2.32 | -2.32 | -2.32 |
| Tax Rate, % | -12.38 | -12.38 | -12.38 | -12.38 | -12.38 | -12.38 | -12.38 | -12.38 | -12.38 | -12.38 |
| EBITAT | -2.9 | -1.7 | -3.9 | -.8 | -7.8 | -4.1 | -4.5 | -5.0 | -5.6 | -6.2 |
| Depreciation | ||||||||||
| Changes in Account Receivables | ||||||||||
| Changes in Inventories | ||||||||||
| Changes in Accounts Payable | ||||||||||
| Capital Expenditure | ||||||||||
| UFCF | -8.6 | -2.3 | -6.3 | -.1 | 7.8 | -4.8 | -.2 | -.3 | -.3 | -.3 |
| WACC, % | 9.76 | 9.74 | 9.7 | 9.63 | 9.76 | 9.72 | 9.72 | 9.72 | 9.72 | 9.72 |
| PV UFCF | ||||||||||
| SUM PV UFCF | -5.1 | |||||||||
| Long Term Growth Rate, % | 4.00 | |||||||||
| Free cash flow (T + 1) | 0 | |||||||||
| Terminal Value | -6 | |||||||||
| Present Terminal Value | -4 | |||||||||
| Enterprise Value | -9 | |||||||||
| Net Debt | -2 | |||||||||
| Equity Value | -7 | |||||||||
| Diluted Shares Outstanding, MM | 27 | |||||||||
| Equity Value Per Share | -0.26 |
What You Will Get
- Comprehensive OOMA Financials: Access to historical and projected data for precise valuation.
- Customizable Inputs: Adjust WACC, tax rates, revenue growth, and capital expenditures as needed.
- Real-Time Calculations: Dynamic computation of intrinsic value and NPV.
- Scenario Analysis: Evaluate various scenarios to assess Ooma’s future performance.
- User-Friendly Interface: Designed for professionals while remaining approachable for newcomers.
Key Features
- 🔍 Real-Life OOMA Financials: Pre-filled historical and projected data for Ooma, Inc. (OOMA).
- ✏️ Fully Customizable Inputs: Adjust all critical parameters (yellow cells) like WACC, growth %, and tax rates.
- 📊 Professional DCF Valuation: Built-in formulas calculate Ooma’s intrinsic value using the Discounted Cash Flow method.
- ⚡ Instant Results: Visualize Ooma’s valuation instantly after making changes.
- Scenario Analysis: Test and compare outcomes for various financial assumptions side-by-side.
How It Works
- Download: Get the pre-built Excel file featuring Ooma, Inc.'s (OOMA) financial data.
- Customize: Modify projections such as revenue growth, EBITDA %, and WACC to fit your analysis.
- Update Automatically: Watch as the intrinsic value and NPV calculations refresh in real-time.
- Test Scenarios: Develop various forecasts and instantly compare the results.
- Make Decisions: Leverage the valuation insights to inform your investment choices.
Why Choose This Calculator for Ooma, Inc. (OOMA)?
- Accurate Data: Utilize real Ooma financials for trustworthy valuation outcomes.
- Customizable: Tailor essential parameters such as growth rates, WACC, and tax rates to align with your forecasts.
- Time-Saving: Pre-configured calculations save you the hassle of starting from the ground up.
- Professional-Grade Tool: Crafted for investors, analysts, and consultants in the telecommunications sector.
- User-Friendly: Intuitive design and step-by-step guidance ensure accessibility for all users.
Who Should Use Ooma, Inc. (OOMA)?
- Small Business Owners: Enhance communication with reliable VoIP services tailored for your needs.
- Remote Teams: Streamline collaboration with user-friendly video conferencing and messaging tools.
- IT Professionals: Integrate advanced communication solutions easily into existing systems.
- Home Users: Enjoy cost-effective home phone services without compromising on quality.
- Tech Enthusiasts: Explore innovative features and functionalities that improve everyday communication.
What the Template Contains
- Operating and Balance Sheet Data: Pre-filled Ooma, Inc. historical data and forecasts, including revenue, EBITDA, EBIT, and capital expenditures.
- WACC Calculation: A dedicated sheet for Weighted Average Cost of Capital (WACC), including parameters like Beta, risk-free rate, and share price.
- DCF Valuation (Unlevered and Levered): Editable Discounted Cash Flow models showing intrinsic value with detailed calculations.
- Financial Statements: Pre-loaded financial statements (annual and quarterly) to support analysis.
- Key Ratios: Includes profitability, leverage, and efficiency ratios for Ooma, Inc. (OOMA).
- Dashboard and Charts: Visual summary of valuation outputs and assumptions to analyze results easily.
Disclaimer
All information, articles, and product details provided on this website are for general informational and educational purposes only. We do not claim any ownership over, nor do we intend to infringe upon, any trademarks, copyrights, logos, brand names, or other intellectual property mentioned or depicted on this site. Such intellectual property remains the property of its respective owners, and any references here are made solely for identification or informational purposes, without implying any affiliation, endorsement, or partnership.
We make no representations or warranties, express or implied, regarding the accuracy, completeness, or suitability of any content or products presented. Nothing on this website should be construed as legal, tax, investment, financial, medical, or other professional advice. In addition, no part of this site—including articles or product references—constitutes a solicitation, recommendation, endorsement, advertisement, or offer to buy or sell any securities, franchises, or other financial instruments, particularly in jurisdictions where such activity would be unlawful.
All content is of a general nature and may not address the specific circumstances of any individual or entity. It is not a substitute for professional advice or services. Any actions you take based on the information provided here are strictly at your own risk. You accept full responsibility for any decisions or outcomes arising from your use of this website and agree to release us from any liability in connection with your use of, or reliance upon, the content or products found herein.