
|
Oportun Financial Corporation (OPRT) DCF Valuation |
Fully Editable: Tailor To Your Needs In Excel Or Sheets
Professional Design: Trusted, Industry-Standard Templates
Investor-Approved Valuation Models
MAC/PC Compatible, Fully Unlocked
No Expertise Is Needed; Easy To Follow
Oportun Financial Corporation (OPRT) Bundle
Enhance your investment strategy with the Oportun Financial Corporation (OPRT) DCF Calculator! Explore authentic financial data, adjust growth projections and expenses, and instantly observe how these modifications affect Oportun's intrinsic value.
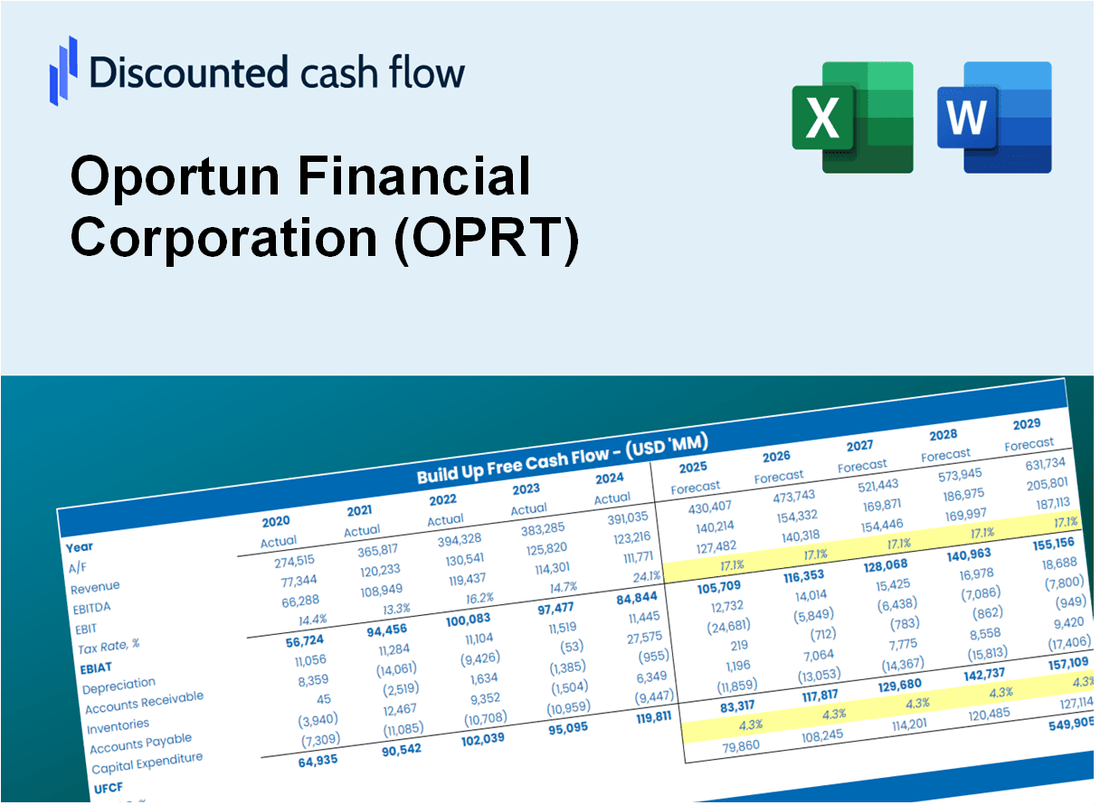
Discounted Cash Flow (DCF) - (USD MM)
| Year | AY1 2020 |
AY2 2021 |
AY3 2022 |
AY4 2023 |
AY5 2024 |
FY1 2025 |
FY2 2026 |
FY3 2027 |
FY4 2028 |
FY5 2029 |
|---|---|---|---|---|---|---|---|---|---|---|
| Revenue | 525.4 | 578.2 | 859.5 | 1,056.9 | 1,001.8 | 1,193.3 | 1,421.4 | 1,693.1 | 2,016.7 | 2,402.2 |
| Revenue Growth, % | 0 | 10.05 | 48.66 | 22.97 | -5.22 | 19.12 | 19.12 | 19.12 | 19.12 | 19.12 |
| EBITDA | -37.9 | 89.9 | -27.8 | -198.8 | -64.0 | -47.9 | -57.1 | -68.0 | -81.0 | -96.5 |
| EBITDA, % | -7.21 | 15.55 | -3.23 | -18.81 | -6.39 | -4.02 | -4.02 | -4.02 | -4.02 | -4.02 |
| Depreciation | 20.2 | 27.1 | 47.5 | 54.9 | 51.2 | 58.2 | 69.3 | 82.5 | 98.3 | 117.1 |
| Depreciation, % | 3.85 | 4.69 | 5.53 | 5.19 | 5.11 | 4.87 | 4.87 | 4.87 | 4.87 | 4.87 |
| EBIT | -58.1 | 62.8 | -75.3 | -253.7 | -115.2 | -106.1 | -126.4 | -150.5 | -179.3 | -213.6 |
| EBIT, % | -11.06 | 10.86 | -8.76 | -24 | -11.5 | -8.89 | -8.89 | -8.89 | -8.89 | -8.89 |
| Total Cash | 136.2 | 131.0 | 98.8 | 91.2 | 60.0 | 178.3 | 212.3 | 252.9 | 301.3 | 358.9 |
| Total Cash, percent | .0 | .0 | .0 | .0 | .0 | .0 | .0 | .0 | .0 | .0 |
| Account Receivables | 15.4 | 20.9 | 11.1 | 8.8 | 8.4 | 22.7 | 27.0 | 32.2 | 38.4 | 45.7 |
| Account Receivables, % | 2.93 | 3.61 | 1.29 | 0.83081 | 0.83771 | 1.9 | 1.9 | 1.9 | 1.9 | 1.9 |
| Inventories | .0 | -225.9 | -177.6 | -100.0 | .0 | -165.1 | -196.7 | -234.3 | -279.1 | -332.4 |
| Inventories, % | 0 | -39.07 | -20.66 | -9.46 | 0 | -13.84 | -13.84 | -13.84 | -13.84 | -13.84 |
| Accounts Payable | 5.2 | 11.6 | 18.1 | 13.7 | 17.6 | 19.5 | 23.2 | 27.7 | 33.0 | 39.3 |
| Accounts Payable, % | 0.99911 | 2.01 | 2.11 | 1.3 | 1.76 | 1.63 | 1.63 | 1.63 | 1.63 | 1.63 |
| Capital Expenditure | -26.6 | -26.5 | -48.9 | -31.3 | -19.2 | -48.2 | -57.4 | -68.4 | -81.5 | -97.1 |
| Capital Expenditure, % | -5.06 | -4.58 | -5.69 | -2.96 | -1.92 | -4.04 | -4.04 | -4.04 | -4.04 | -4.04 |
| Tax Rate, % | 31.69 | 31.69 | 31.69 | 31.69 | 31.69 | 31.69 | 31.69 | 31.69 | 31.69 | 31.69 |
| EBITAT | -45.1 | 47.4 | -77.8 | -180.0 | -78.7 | -83.3 | -99.2 | -118.1 | -140.7 | -167.6 |
| Depreciation | ||||||||||
| Changes in Account Receivables | ||||||||||
| Changes in Inventories | ||||||||||
| Changes in Accounts Payable | ||||||||||
| Capital Expenditure | ||||||||||
| UFCF | -61.6 | 274.8 | -111.2 | -236.0 | -142.4 | 79.4 | -56.4 | -67.2 | -80.0 | -95.3 |
| WACC, % | 6.79 | 6.62 | 8.54 | 6.26 | 6.06 | 6.85 | 6.85 | 6.85 | 6.85 | 6.85 |
| PV UFCF | ||||||||||
| SUM PV UFCF | -159.9 | |||||||||
| Long Term Growth Rate, % | 2.00 | |||||||||
| Free cash flow (T + 1) | -97 | |||||||||
| Terminal Value | -2,003 | |||||||||
| Present Terminal Value | -1,438 | |||||||||
| Enterprise Value | -1,598 | |||||||||
| Net Debt | 2,762 | |||||||||
| Equity Value | -4,360 | |||||||||
| Diluted Shares Outstanding, MM | 40 | |||||||||
| Equity Value Per Share | -108.04 |
What You Will Receive
- Flexible Forecast Inputs: Modify key assumptions (growth %, margins, WACC) to explore various scenarios.
- Real-World Data: Oportun Financial Corporation’s (OPRT) financial data pre-loaded to accelerate your analysis.
- Automated DCF Outputs: The model computes Net Present Value (NPV) and intrinsic value for you.
- Customizable and Professional: A refined Excel model tailored to meet your valuation requirements.
- Designed for Analysts and Investors: Perfect for evaluating projections, confirming strategies, and enhancing efficiency.
Key Features
- Comprehensive Loan Calculator: Offers detailed models for various loan scenarios tailored for Oportun Financial Corporation (OPRT).
- Credit Risk Assessment Tool: Pre-built sheet to evaluate creditworthiness with adjustable parameters.
- Customizable Financial Projections: Adjust assumptions for interest rates, repayment terms, and borrower profiles.
- Integrated Financial Metrics: Review key performance indicators related to lending efficiency and profitability for Oportun Financial Corporation (OPRT).
- User-Friendly Dashboard: Visual representations of important financial data for quick insights and decision-making.
How It Works
- Step 1: Download the prebuilt Excel template featuring Oportun Financial Corporation's (OPRT) data.
- Step 2: Navigate through the pre-filled sheets to familiarize yourself with the essential metrics.
- Step 3: Adjust forecasts and assumptions in the editable yellow cells (WACC, growth, margins).
- Step 4: Instantly see the recalculated results, including Oportun Financial Corporation's intrinsic value.
- Step 5: Utilize the outputs to make informed investment decisions or to create comprehensive reports.
Why Choose This Calculator for Oportun Financial Corporation (OPRT)?
- Accurate Data: Utilize real Oportun financials for dependable valuation outcomes.
- Customizable: Tailor essential parameters such as growth rates, WACC, and tax rates to fit your forecasts.
- Time-Saving: Built-in calculations save you from starting from the ground up.
- Professional-Grade Tool: Crafted for investors, analysts, and financial consultants.
- User-Friendly: Easy-to-navigate design and clear instructions ensure accessibility for all users.
Who Should Use This Product?
- Investors: Accurately estimate Oportun Financial Corporation’s fair value before making investment decisions.
- CFOs: Leverage a professional-grade DCF model for financial reporting and analysis related to OPRT.
- Consultants: Quickly adapt the template for valuation reports for clients interested in Oportun Financial Corporation.
- Entrepreneurs: Gain insights into financial modeling techniques employed by leading financial service companies.
- Educators: Use it as a teaching tool to illustrate valuation methodologies relevant to Oportun Financial Corporation.
What the Template Contains
- Preloaded OPRT Data: Historical and projected financial data, including revenue, EBIT, and capital expenditures.
- DCF and WACC Models: Professional-grade sheets for calculating intrinsic value and Weighted Average Cost of Capital.
- Editable Inputs: Yellow-highlighted cells for adjusting revenue growth, tax rates, and discount rates.
- Financial Statements: Comprehensive annual and quarterly financials for deeper analysis.
- Key Ratios: Profitability, leverage, and efficiency ratios to evaluate performance.
- Dashboard and Charts: Visual summaries of valuation outcomes and assumptions.
Disclaimer
All information, articles, and product details provided on this website are for general informational and educational purposes only. We do not claim any ownership over, nor do we intend to infringe upon, any trademarks, copyrights, logos, brand names, or other intellectual property mentioned or depicted on this site. Such intellectual property remains the property of its respective owners, and any references here are made solely for identification or informational purposes, without implying any affiliation, endorsement, or partnership.
We make no representations or warranties, express or implied, regarding the accuracy, completeness, or suitability of any content or products presented. Nothing on this website should be construed as legal, tax, investment, financial, medical, or other professional advice. In addition, no part of this site—including articles or product references—constitutes a solicitation, recommendation, endorsement, advertisement, or offer to buy or sell any securities, franchises, or other financial instruments, particularly in jurisdictions where such activity would be unlawful.
All content is of a general nature and may not address the specific circumstances of any individual or entity. It is not a substitute for professional advice or services. Any actions you take based on the information provided here are strictly at your own risk. You accept full responsibility for any decisions or outcomes arising from your use of this website and agree to release us from any liability in connection with your use of, or reliance upon, the content or products found herein.