
|
OneSpaWorld Holdings Limited (OSW) DCF Valuation |
Fully Editable: Tailor To Your Needs In Excel Or Sheets
Professional Design: Trusted, Industry-Standard Templates
Investor-Approved Valuation Models
MAC/PC Compatible, Fully Unlocked
No Expertise Is Needed; Easy To Follow
OneSpaWorld Holdings Limited (OSW) Bundle
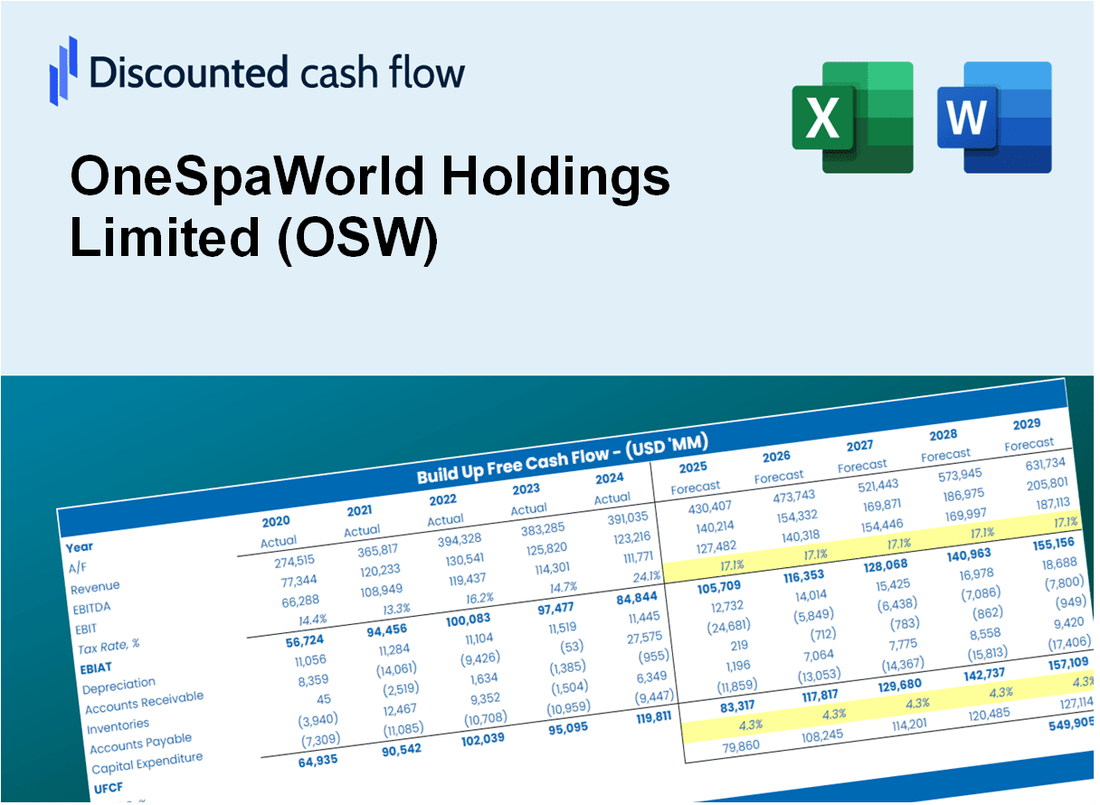
Streamline your analysis and improve precision with our (OSW) DCF Calculator! Utilizing actual data from OneSpaWorld Holdings Limited, along with customizable assumptions, this tool empowers you to forecast, analyze, and value (OSW) just like a seasoned investor.
What You Will Receive
- Adjustable Forecast Variables: Modify key assumptions (growth %, margins, WACC) to explore various scenarios.
- Comprehensive Market Data: OneSpaWorld Holdings Limited’s (OSW) financial data pre-loaded to facilitate your analysis.
- Instant DCF Calculations: The template automatically computes Net Present Value (NPV) and intrinsic value for you.
- Flexible and Professional Design: A refined Excel model tailored to meet your valuation requirements.
- Designed for Analysts and Investors: Perfect for evaluating projections, confirming strategies, and enhancing efficiency.
Key Features
- Customizable Service Parameters: Adjust essential metrics such as treatment pricing, customer retention rates, and operational costs.
- Instant Revenue Projections: Quickly generates forecasts, cash flow estimates, and other financial metrics.
- High-Precision Analytics: Leverages OneSpaWorld's (OSW) real operational data for accurate financial insights.
- Effortless Scenario Planning: Evaluate various business strategies and assess their potential impacts with ease.
- Efficiency Booster: Streamline your planning process without the hassle of creating intricate financial models from the ground up.
How It Works
- 1. Access the Template: Download and open the Excel file featuring OneSpaWorld Holdings Limited’s (OSW) preloaded data.
- 2. Modify Assumptions: Adjust essential inputs such as growth rates, WACC, and capital expenditures.
- 3. View Results Instantly: The DCF model automatically calculates the intrinsic value and NPV.
- 4. Explore Scenarios: Evaluate various forecasts to understand different valuation possibilities.
- 5. Present with Assurance: Deliver professional valuation insights to back your decisions.
Why Choose This Calculator for OneSpaWorld Holdings Limited (OSW)?
- Accuracy: Utilizes real financial data from OneSpaWorld for precise calculations.
- Flexibility: Allows users to easily adjust and experiment with various inputs.
- Time-Saving: Avoid the complexities of creating a DCF model from the ground up.
- Professional-Grade: Crafted with the expertise and detail expected by CFOs.
- User-Friendly: Intuitive interface suitable for users without extensive financial modeling skills.
Who Should Use This Product?
- Investors: Evaluate OneSpaWorld Holdings Limited's (OSW) valuation before making trading decisions.
- CFOs and Financial Analysts: Optimize valuation methodologies and assess financial forecasts.
- Startup Founders: Understand the valuation strategies of leading companies like OneSpaWorld Holdings Limited (OSW).
- Consultants: Provide comprehensive valuation analyses and reports for clients in the wellness industry.
- Students and Educators: Utilize current market data to practice and teach valuation principles.
What the Template Contains
- Comprehensive DCF Model: Editable template featuring detailed valuation calculations tailored for OneSpaWorld Holdings Limited (OSW).
- Real-World Data: Historical and projected financials for OneSpaWorld preloaded for thorough analysis.
- Customizable Parameters: Modify WACC, growth rates, and tax assumptions to explore different scenarios.
- Financial Statements: Complete annual and quarterly breakdowns for in-depth insights.
- Key Ratios: Integrated analysis for profitability, efficiency, and leverage metrics.
- Dashboard with Visual Outputs: Charts and tables designed for clear, actionable results.
Disclaimer
All information, articles, and product details provided on this website are for general informational and educational purposes only. We do not claim any ownership over, nor do we intend to infringe upon, any trademarks, copyrights, logos, brand names, or other intellectual property mentioned or depicted on this site. Such intellectual property remains the property of its respective owners, and any references here are made solely for identification or informational purposes, without implying any affiliation, endorsement, or partnership.
We make no representations or warranties, express or implied, regarding the accuracy, completeness, or suitability of any content or products presented. Nothing on this website should be construed as legal, tax, investment, financial, medical, or other professional advice. In addition, no part of this site—including articles or product references—constitutes a solicitation, recommendation, endorsement, advertisement, or offer to buy or sell any securities, franchises, or other financial instruments, particularly in jurisdictions where such activity would be unlawful.
All content is of a general nature and may not address the specific circumstances of any individual or entity. It is not a substitute for professional advice or services. Any actions you take based on the information provided here are strictly at your own risk. You accept full responsibility for any decisions or outcomes arising from your use of this website and agree to release us from any liability in connection with your use of, or reliance upon, the content or products found herein.