
|
Ontrak, Inc. (OTRK) DCF Valuation |
Fully Editable: Tailor To Your Needs In Excel Or Sheets
Professional Design: Trusted, Industry-Standard Templates
Investor-Approved Valuation Models
MAC/PC Compatible, Fully Unlocked
No Expertise Is Needed; Easy To Follow
Ontrak, Inc. (OTRK) Bundle
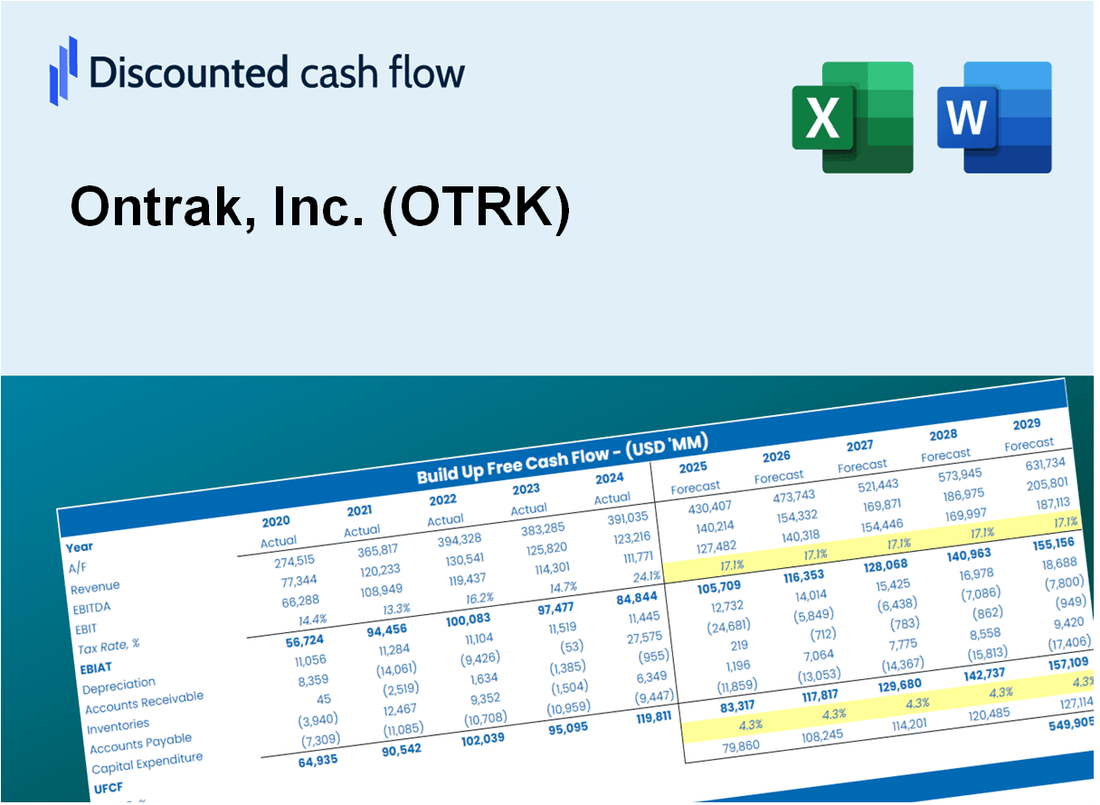
Gain insight into your Ontrak, Inc. (OTRK) valuation analysis with our state-of-the-art DCF Calculator! Equipped with real-time OTRK data, this Excel template enables you to adjust forecasts and assumptions to accurately determine the intrinsic value of Ontrak, Inc.
What You Will Get
- Comprehensive OTRK Financials: Access historical and projected data for precise valuation.
- Customizable Inputs: Adjust WACC, tax rates, revenue growth, and capital expenditures to suit your analysis.
- Dynamic Calculations: Intrinsic value and NPV are computed in real-time.
- Scenario Analysis: Explore various scenarios to assess Ontrak’s future performance.
- User-Friendly Interface: Designed for professionals while remaining approachable for newcomers.
Key Features
- Customizable Performance Metrics: Adjust essential inputs such as patient engagement rates, revenue per patient, and operational costs.
- Instant DCF Valuation: Quickly computes intrinsic value, NPV, and other financial metrics.
- High-Precision Accuracy: Leverages Ontrak's (OTRK) actual financial data for credible valuation results.
- Effortless Scenario Analysis: Evaluate various assumptions and analyze results with ease.
- Efficiency Booster: Avoid the hassle of creating intricate valuation models from the ground up.
How It Works
- Download: Get the pre-built Excel file containing Ontrak, Inc.'s (OTRK) financial data.
- Customize: Modify projections, including revenue growth, EBITDA %, and WACC.
- Update Automatically: The intrinsic value and NPV calculations refresh in real-time.
- Test Scenarios: Develop various projections and compare results instantly.
- Make Decisions: Utilize the valuation findings to inform your investment strategy.
Why Choose This Calculator for Ontrak, Inc. (OTRK)?
- Designed for Experts: A specialized tool favored by financial analysts, CFOs, and industry consultants.
- Accurate Data: Ontrak’s historical and anticipated financials are preloaded for precision.
- Flexible Scenario Analysis: Effortlessly test various forecasts and assumptions.
- Comprehensive Outputs: Instantly computes intrinsic value, NPV, and essential metrics.
- User-Friendly Interface: Detailed instructions walk you through each step of the calculation.
Who Should Use This Product?
- Individual Investors: Gain insights to make informed decisions about buying or selling Ontrak, Inc. (OTRK) stock.
- Financial Analysts: Enhance valuation processes with efficient, ready-to-use financial models for Ontrak, Inc. (OTRK).
- Consultants: Provide clients with professional valuation insights on Ontrak, Inc. (OTRK) swiftly and accurately.
- Business Owners: Learn how companies like Ontrak, Inc. (OTRK) are valued to inform your own business strategies.
- Finance Students: Explore valuation techniques using real-world data and case studies related to Ontrak, Inc. (OTRK).
What the Template Contains
- Comprehensive DCF Model: Editable template with detailed valuation calculations for Ontrak, Inc. (OTRK).
- Real-World Data: Ontrak’s historical and projected financials preloaded for analysis.
- Customizable Parameters: Adjust WACC, growth rates, and tax assumptions to test scenarios specific to Ontrak, Inc. (OTRK).
- Financial Statements: Full annual and quarterly breakdowns for deeper insights into Ontrak's performance.
- Key Ratios: Built-in analysis for profitability, efficiency, and leverage tailored to Ontrak, Inc. (OTRK).
- Dashboard with Visual Outputs: Charts and tables for clear, actionable results regarding Ontrak, Inc. (OTRK).
Disclaimer
All information, articles, and product details provided on this website are for general informational and educational purposes only. We do not claim any ownership over, nor do we intend to infringe upon, any trademarks, copyrights, logos, brand names, or other intellectual property mentioned or depicted on this site. Such intellectual property remains the property of its respective owners, and any references here are made solely for identification or informational purposes, without implying any affiliation, endorsement, or partnership.
We make no representations or warranties, express or implied, regarding the accuracy, completeness, or suitability of any content or products presented. Nothing on this website should be construed as legal, tax, investment, financial, medical, or other professional advice. In addition, no part of this site—including articles or product references—constitutes a solicitation, recommendation, endorsement, advertisement, or offer to buy or sell any securities, franchises, or other financial instruments, particularly in jurisdictions where such activity would be unlawful.
All content is of a general nature and may not address the specific circumstances of any individual or entity. It is not a substitute for professional advice or services. Any actions you take based on the information provided here are strictly at your own risk. You accept full responsibility for any decisions or outcomes arising from your use of this website and agree to release us from any liability in connection with your use of, or reliance upon, the content or products found herein.