
|
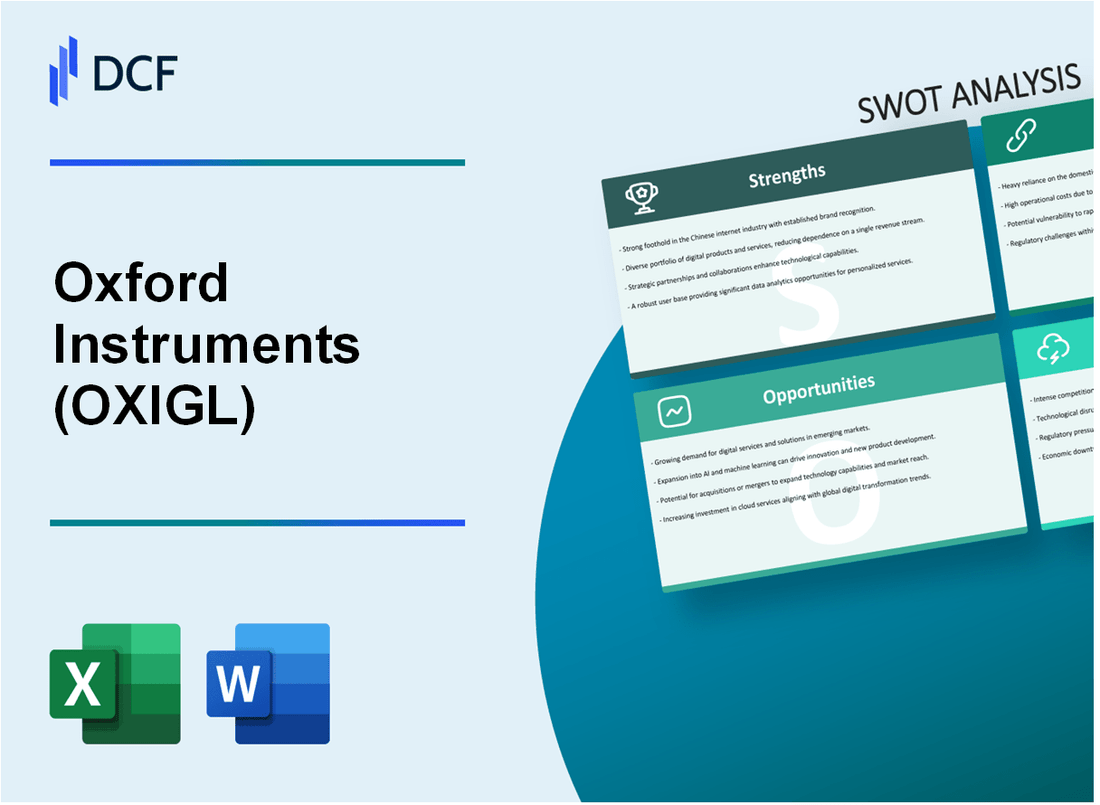
Oxford Instruments plc (OXIG.L): SWOT Analysis |
Fully Editable: Tailor To Your Needs In Excel Or Sheets
Professional Design: Trusted, Industry-Standard Templates
Investor-Approved Valuation Models
MAC/PC Compatible, Fully Unlocked
No Expertise Is Needed; Easy To Follow
Oxford Instruments plc (OXIG.L) Bundle
In the competitive landscape of high-tech scientific instruments, Oxford Instruments plc stands out with its innovative edge and strong market position. But like any company, it faces unique challenges and opportunities that shape its strategic direction. In this post, we delve into a comprehensive SWOT analysis that reveals the strengths, weaknesses, opportunities, and threats influencing Oxford Instruments' future. Discover how this esteemed player navigates the complexities of its industry and what lies ahead for its growth and sustainability.
Oxford Instruments plc - SWOT Analysis: Strengths
Oxford Instruments plc showcases a diverse product portfolio across various high-tech sectors, including scientific and industrial instrumentation. Their offerings span sectors such as nanotechnology, materials analysis, and semiconductor manufacturing. This diversification aids in mitigating risks associated with market fluctuations and enhances growth opportunities.
With a strong brand reputation and a rich heritage in scientific research instruments, Oxford Instruments has maintained its status since its founding in 1959. The company is widely recognized for its innovation and quality in scientific applications, contributing to long-standing relationships with customers in various industries, including academia, healthcare, and manufacturing.
Oxford Instruments has demonstrated a robust financial performance with consistent revenue growth. For the financial year ending 2023, the company reported revenues of approximately £473 million, reflecting a year-on-year increase of about 5%. This growth trajectory positions them favorably within their industry.
| Year | Revenue (£ million) | Year-on-Year Growth (%) | Net Income (£ million) | Earnings Per Share (£) |
|---|---|---|---|---|
| 2023 | 473 | 5 | 70 | 0.45 |
| 2022 | 450 | 8 | 65 | 0.43 |
| 2021 | 416 | -2 | 62 | 0.40 |
Furthermore, the company has established a global presence and distribution network, with operations in over 30 countries. This extensive reach not only enhances their market competitiveness but also allows them to serve a diverse customer base. The international sales accounted for approximately 75% of their total revenue in 2023, underscoring the effectiveness of their global strategy.
Oxford Instruments prides itself on a high level of expertise in nanotechnology and materials analysis. They invest significantly in research and development, with R&D spending amounting to approximately £40 million in 2023, constituting roughly 8.5% of their total revenue. This commitment to innovation has resulted in numerous patents and advanced technologies, enabling them to maintain a competitive edge in the market.
Oxford Instruments plc - SWOT Analysis: Weaknesses
Oxford Instruments plc exhibits several weaknesses that could impact its business operations and financial performance. Understanding these drawbacks is crucial for stakeholders considering investments or strategic decisions within the company.
High dependency on specific market segments and products
Oxford Instruments relies heavily on key markets such as healthcare and academia, specifically in its high-tech analytical and imaging instruments. In the financial year 2022, approximately 55% of total revenue was generated from its Materials and Characterization division, highlighting this dependency on a finite array of products.
Vulnerability to currency fluctuations due to international operations
The company operates globally, with significant sales in international markets. In FY 2023, around 65% of revenues came from exports, making it susceptible to currency risks. The recent volatility of the Euro and US Dollar has led to fluctuations in revenue that were reflected in an exchange impact loss estimated at £2.5 million during the same period.
Limited scale compared to larger competitors
Compared to competitors like Thermo Fisher Scientific and Agilent Technologies, Oxford Instruments has a relatively smaller market share. In 2022, Thermo Fisher reported revenues of approximately $40 billion, while Oxford Instruments' revenue stood at £360 million, indicating a significant scale disadvantage.
Potential for high R&D costs impacting profitability
Research and Development is a critical part of Oxford Instruments' strategy, with R&D expenses accounting for roughly 12% of total revenue in FY 2023. This high expenditure can pressure margins. The company's operating profit for the same year was reported at £42 million, which shows a decline from the previous year largely due to increased R&D costs.
Complexity in integrating acquisitions can strain resources
Recent acquisitions, such as the purchase of Andor Technology in 2017, require substantial integration efforts. Despite increasing revenue from acquisitions, the operational complexities have led to £10 million in one-time integration costs, impacting net income by approximately 8% in the fiscal year following the acquisition.
| Weaknesses | Details | Impacts |
|---|---|---|
| Market Dependency | 55% of revenue from Materials and Characterization division | Risk of revenue loss if market demand shifts |
| Currency Vulnerability | 65% revenue from international sales | Estimated exchange impact loss: £2.5 million |
| Scale Limitations | Revenue: £360 million vs. Thermo Fisher's $40 billion | Lower market influence and competitiveness |
| High R&D Costs | R&D costs: 12% of total revenue | Operating profit decline: £42 million |
| Acquisition Complexity | Integration costs post-acquisition: £10 million | Net income impact: approximately 8% |
Oxford Instruments plc - SWOT Analysis: Opportunities
Oxford Instruments plc operates in a landscape characterized by an expanding demand for advanced materials and nanotechnology solutions. According to the Markets and Markets report, the global nanotechnology market is projected to grow from $2.6 billion in 2021 to $24.5 billion by 2026, representing a compound annual growth rate (CAGR) of 44.5%. This growing demand signifies a robust opportunity for Oxford Instruments to enhance its portfolio in this field.
Additionally, emerging markets present a significant growth potential, particularly in regions like Asia-Pacific and Latin America. The International Monetary Fund forecasts that the Asia-Pacific region will witness an economic growth of approximately 5.0% annually, driving increased technological needs. Oxford Instruments can strategically position itself to cater to these markets, capitalizing on the rising investments in research and development.
Strategic partnerships and collaborations with research institutions are essential for fostering innovation. Oxford Instruments has already engaged with various universities and research organizations. For instance, in 2022, the company announced a collaboration with University College London aimed at developing cutting-edge imaging technologies. Such partnerships can enhance their R&D efforts and accelerate product development cycles.
Innovation in sustainable and energy-efficient products is also gaining traction. The global market for sustainable technologies is expected to reach $2 trillion by 2030, as stated by McKinsey. Oxford Instruments can leverage its expertise in developing energy-efficient solutions to capture a portion of this burgeoning market, meeting customer demand for environmentally friendly products.
Lastly, the potential to leverage digital transformation for operational enhancements is vast. The Global Digital Transformation Market is expected to grow from $469 billion in 2020 to $1.2 trillion by 2025, at a CAGR of 22.1%. By integrating digital technologies into its operations, Oxford Instruments can improve efficiency, reduce costs, and enhance customer engagement.
| Opportunity | Market Size/Projection | CAGR | Timeframe |
|---|---|---|---|
| Nano-technology Market | $2.6 billion (2021) to $24.5 billion (2026) | 44.5% | 2021-2026 |
| Sustainable Technologies Market | $2 trillion (by 2030) | N/A | By 2030 |
| Digital Transformation Market | $469 billion (2020) to $1.2 trillion (2025) | 22.1% | 2020-2025 |
Oxford Instruments plc - SWOT Analysis: Threats
Oxford Instruments plc faces several critical threats that could impact its market standing and financial performance.
Intense competition from larger, well-capitalized companies
The market for scientific instrumentation is heavily contested, with major players such as Thermo Fisher Scientific, Agilent Technologies, and Bruker Corporation. In 2022, Thermo Fisher reported revenues of approximately £38 billion, which is significantly larger than Oxford Instruments, whose revenue for the same period was around £437.2 million. This stark contrast in size and capital can place pressure on Oxford Instruments' pricing strategies and market share.
Rapid technological advancements requiring continuous adaptation
The scientific instrument market is characterized by rapid technological changes. For instance, advancements in nanotechnology and materials science necessitate significant investment in research and development. Oxford Instruments allocated about 12% of its total revenue to R&D in the last fiscal year, but competitors may have bigger budgets, such as Agilent’s R&D expenditure of $1.62 billion in 2022. Failure to keep pace with new technologies could lead to a decline in competitive advantage.
Economic uncertainties affecting customer investment in new technologies
The global economy is currently facing uncertainties due to inflationary pressures and potential recessions. According to the Bank of England, UK inflation rates reached 10.1% in September 2022, impacting capital expenditure decisions among customers. Industries heavily reliant on Oxford Instruments' products may postpone investments in new technology, adversely affecting sales growth and revenue stability.
Regulatory changes and compliance issues in different regions
Compliance with international regulations is a persistent threat. Oxford Instruments operates in over 40 countries, and differing regulatory landscapes can complicate operations. For example, the EU's General Data Protection Regulation (GDPR) has imposed stringent regulations, and non-compliance can lead to fines of up to €20 million or 4% of global annual turnover, whichever is higher. This poses a risk to operational costs and legal compliance.
Supply chain disruptions impacting production and delivery timelines
Recent global events have highlighted vulnerabilities in supply chains. For instance, semiconductor shortages have affected many manufacturing sectors, including those relevant to Oxford Instruments. The company reported delays in product delivery which impacted its operational efficiency and customer satisfaction. According to a recent survey, about 75% of businesses in the science sector have faced supply chain disruptions, which could lead to a projected revenue loss of around £1 billion across the industry.
| Threats | Impact | Financial Implications |
|---|---|---|
| Competition | Increased pricing pressure | Potential revenue decline |
| Technological Advancements | Need for continuous R&D investments | 12% of revenue allocation |
| Economic Uncertainty | Reduced customer investment | Potential revenue stagnation |
| Regulatory Changes | Compliance costs and risks | Fines up to €20 million |
| Supply Chain Disruption | Operational inefficiencies | Projected industry revenue loss of £1 billion |
The SWOT analysis of Oxford Instruments plc highlights its strong footing in the high-tech sector while also identifying critical areas for improvement and strategic growth opportunities. With a diverse product portfolio and robust financial performance, the company is well-positioned, yet it must navigate challenges such as competition and market fluctuations to sustain its innovation-driven trajectory.
Disclaimer
All information, articles, and product details provided on this website are for general informational and educational purposes only. We do not claim any ownership over, nor do we intend to infringe upon, any trademarks, copyrights, logos, brand names, or other intellectual property mentioned or depicted on this site. Such intellectual property remains the property of its respective owners, and any references here are made solely for identification or informational purposes, without implying any affiliation, endorsement, or partnership.
We make no representations or warranties, express or implied, regarding the accuracy, completeness, or suitability of any content or products presented. Nothing on this website should be construed as legal, tax, investment, financial, medical, or other professional advice. In addition, no part of this site—including articles or product references—constitutes a solicitation, recommendation, endorsement, advertisement, or offer to buy or sell any securities, franchises, or other financial instruments, particularly in jurisdictions where such activity would be unlawful.
All content is of a general nature and may not address the specific circumstances of any individual or entity. It is not a substitute for professional advice or services. Any actions you take based on the information provided here are strictly at your own risk. You accept full responsibility for any decisions or outcomes arising from your use of this website and agree to release us from any liability in connection with your use of, or reliance upon, the content or products found herein.