
|
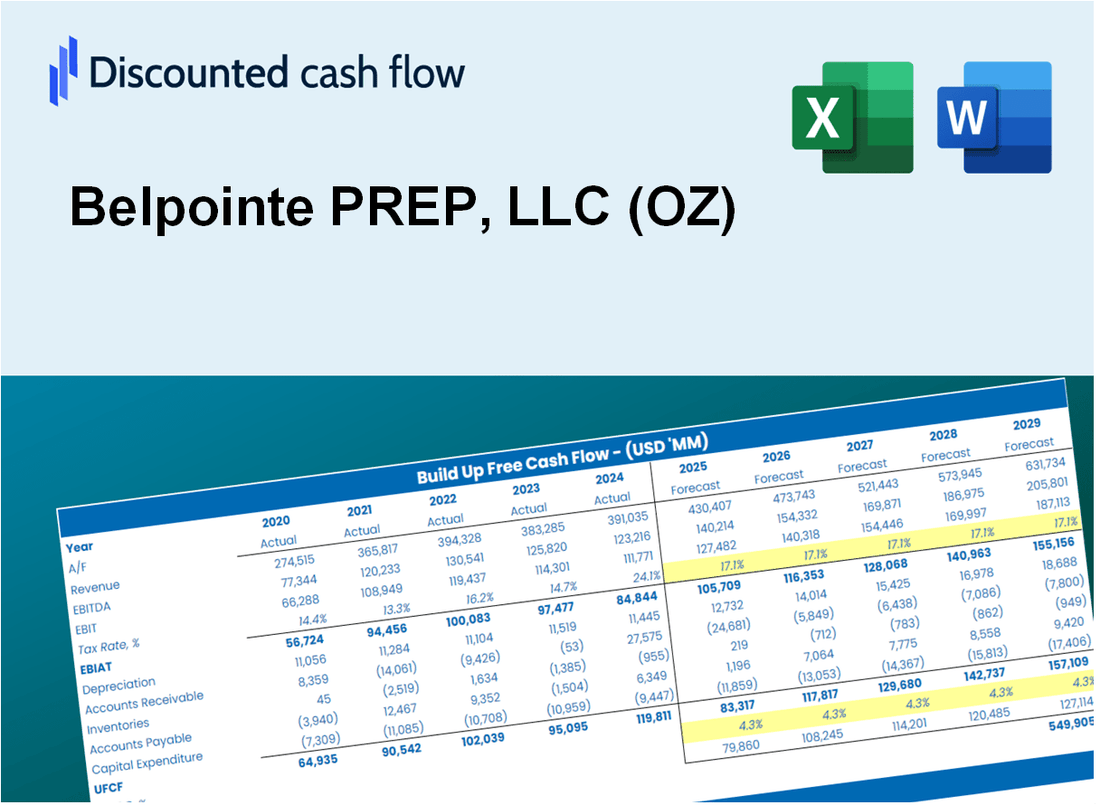
Belpointe PREP, LLC (OZ) DCF Valuation |
Fully Editable: Tailor To Your Needs In Excel Or Sheets
Professional Design: Trusted, Industry-Standard Templates
Investor-Approved Valuation Models
MAC/PC Compatible, Fully Unlocked
No Expertise Is Needed; Easy To Follow
Belpointe PREP, LLC (OZ) Bundle
Explore Belpointe PREP, LLC (OZ) financial future with our user-friendly DCF Calculator! Enter your projections for growth, margins, and expenses to determine the intrinsic value of Belpointe PREP, LLC (OZ) and shape your investment approach.
What You Will Receive
- Flexible Investment Inputs: Modify key assumptions (growth %, returns, risk factors) to explore various investment scenarios.
- Comprehensive Market Data: Belpointe PREP, LLC’s (OZ) financial metrics pre-loaded to facilitate your analysis.
- Instant DCF Calculations: The model automatically computes Net Present Value (NPV) and intrinsic value for your convenience.
- Tailored and Professional Design: A refined Excel framework that adjusts to your valuation requirements.
- Designed for Investors and Analysts: Perfect for evaluating projections, confirming strategies, and enhancing efficiency.
Key Features
- Customizable Investment Metrics: Adjust essential factors such as rental income, operating expenses, and capital improvements.
- Instant Property Valuation: Quickly calculates market value, cash flow, and other key financial indicators.
- High-Precision Estimates: Utilizes Belpointe PREP, LLC’s (OZ) real estate data for accurate valuation results.
- Effortless Scenario Planning: Explore various investment scenarios and analyze results with ease.
- Efficiency Booster: Streamline the valuation process without the hassle of creating intricate models from the ground up.
How It Works
- 1. Access the Template: Download and open the Excel file containing Belpointe PREP, LLC (OZ) [Symbol] data.
- 2. Modify Assumptions: Adjust key variables such as growth rates, WACC, and capital expenditures.
- 3. See Results Immediately: The DCF model automatically computes intrinsic value and NPV.
- 4. Explore Scenarios: Evaluate various forecasts to understand different valuation results.
- 5. Present with Assurance: Share professional valuation insights to enhance your decision-making.
Why Choose Belpointe PREP, LLC (OZ)?
- Save Time: Skip the hassle of complex calculations – our platform is user-friendly and efficient.
- Enhance Accuracy: Dependable financial insights and tools minimize valuation errors.
- Fully Customizable: Adjust the model to align with your unique assumptions and forecasts.
- Easy to Understand: Intuitive charts and outputs simplify the analysis of results.
- Endorsed by Professionals: Crafted for experts who prioritize accuracy and functionality.
Who Should Use Belpointe PREP, LLC (OZ)?
- Real Estate Investors: Understand the intricacies of Opportunity Zones and how to maximize returns.
- Financial Advisors: Integrate innovative investment strategies into client portfolios.
- Developers: Analyze potential projects and evaluate their viability in Opportunity Zones.
- Students: Explore real-world applications of investment theories in the context of Opportunity Zones.
- Small Business Owners: Discover how Opportunity Zone investments can benefit your business growth.
What the Template Contains
- Operating and Balance Sheet Data: Pre-filled Belpointe PREP, LLC (OZ) historical data and forecasts, including revenue, EBITDA, EBIT, and capital expenditures.
- WACC Calculation: A dedicated sheet for Weighted Average Cost of Capital (WACC), featuring parameters like Beta, risk-free rate, and share price.
- DCF Valuation (Unlevered and Levered): Editable Discounted Cash Flow models illustrating intrinsic value with detailed calculations.
- Financial Statements: Pre-loaded financial statements (annual and quarterly) to facilitate analysis.
- Key Ratios: Includes profitability, leverage, and efficiency ratios for Belpointe PREP, LLC (OZ).
- Dashboard and Charts: Visual summary of valuation outputs and assumptions for easy analysis of results.
Disclaimer
All information, articles, and product details provided on this website are for general informational and educational purposes only. We do not claim any ownership over, nor do we intend to infringe upon, any trademarks, copyrights, logos, brand names, or other intellectual property mentioned or depicted on this site. Such intellectual property remains the property of its respective owners, and any references here are made solely for identification or informational purposes, without implying any affiliation, endorsement, or partnership.
We make no representations or warranties, express or implied, regarding the accuracy, completeness, or suitability of any content or products presented. Nothing on this website should be construed as legal, tax, investment, financial, medical, or other professional advice. In addition, no part of this site—including articles or product references—constitutes a solicitation, recommendation, endorsement, advertisement, or offer to buy or sell any securities, franchises, or other financial instruments, particularly in jurisdictions where such activity would be unlawful.
All content is of a general nature and may not address the specific circumstances of any individual or entity. It is not a substitute for professional advice or services. Any actions you take based on the information provided here are strictly at your own risk. You accept full responsibility for any decisions or outcomes arising from your use of this website and agree to release us from any liability in connection with your use of, or reliance upon, the content or products found herein.