
|
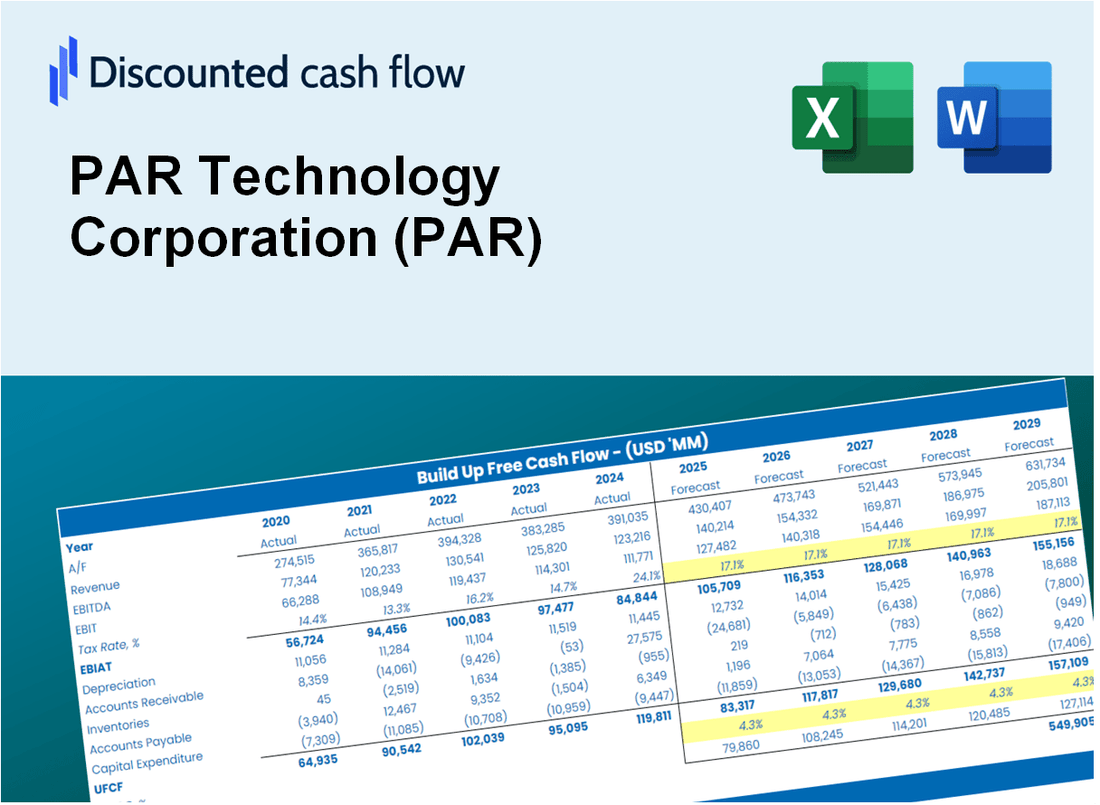
PAR Technology Corporation (PAR) DCF Valuation |
Fully Editable: Tailor To Your Needs In Excel Or Sheets
Professional Design: Trusted, Industry-Standard Templates
Investor-Approved Valuation Models
MAC/PC Compatible, Fully Unlocked
No Expertise Is Needed; Easy To Follow
PAR Technology Corporation (PAR) Bundle
Whether you’re an investor or analyst, this PAR Technology Corporation (PAR) DCF Calculator is your go-to resource for accurate valuation. With real data from PAR Technology Corporation preloaded, you can easily adjust forecasts and observe the effects in real time.
Discounted Cash Flow (DCF) - (USD MM)
| Year | AY1 2020 |
AY2 2021 |
AY3 2022 |
AY4 2023 |
AY5 2024 |
FY1 2025 |
FY2 2026 |
FY3 2027 |
FY4 2028 |
FY5 2029 |
|---|---|---|---|---|---|---|---|---|---|---|
| Revenue | 213.8 | 282.9 | 262.3 | 276.7 | 350.0 | 399.9 | 456.9 | 522.0 | 596.4 | 681.4 |
| Revenue Growth, % | 0 | 32.32 | -7.26 | 5.48 | 26.48 | 14.25 | 14.25 | 14.25 | 14.25 | 14.25 |
| EBITDA | -21.2 | -45.7 | -44.5 | -45.8 | -46.6 | -58.3 | -66.6 | -76.1 | -86.9 | -99.3 |
| EBITDA, % | -9.9 | -16.14 | -16.96 | -16.56 | -13.32 | -14.57 | -14.57 | -14.57 | -14.57 | -14.57 |
| Depreciation | 10.1 | 21.4 | 25.6 | 27.0 | 37.9 | 34.1 | 39.0 | 44.5 | 50.9 | 58.1 |
| Depreciation, % | 4.72 | 7.57 | 9.77 | 9.76 | 10.83 | 8.53 | 8.53 | 8.53 | 8.53 | 8.53 |
| EBIT | -31.3 | -67.1 | -70.1 | -72.8 | -84.5 | -92.4 | -105.6 | -120.6 | -137.8 | -157.4 |
| EBIT, % | -14.62 | -23.71 | -26.73 | -26.32 | -24.15 | -23.11 | -23.11 | -23.11 | -23.11 | -23.11 |
| Total Cash | 180.7 | 188.4 | 110.6 | 74.4 | 108.6 | 200.9 | 229.5 | 262.3 | 299.6 | 342.3 |
| Total Cash, percent | .0 | .0 | .0 | .0 | .0 | .0 | .0 | .0 | .0 | .0 |
| Account Receivables | 43.0 | 50.0 | 60.0 | 42.7 | 59.7 | 74.5 | 85.1 | 97.2 | 111.1 | 126.9 |
| Account Receivables, % | 20.1 | 17.67 | 22.86 | 15.42 | 17.07 | 18.62 | 18.62 | 18.62 | 18.62 | 18.62 |
| Inventories | 21.6 | 35.1 | 37.6 | 23.6 | 21.9 | 41.3 | 47.2 | 53.9 | 61.6 | 70.3 |
| Inventories, % | 10.12 | 12.4 | 14.33 | 8.51 | 6.25 | 10.32 | 10.32 | 10.32 | 10.32 | 10.32 |
| Accounts Payable | 12.8 | 20.8 | 23.3 | 25.6 | 34.8 | 33.1 | 37.8 | 43.2 | 49.4 | 56.4 |
| Accounts Payable, % | 5.98 | 7.37 | 8.87 | 9.25 | 9.94 | 8.28 | 8.28 | 8.28 | 8.28 | 8.28 |
| Capital Expenditure | -1.3 | -8.3 | -7.4 | -10.4 | -6.8 | -9.6 | -11.0 | -12.6 | -14.4 | -16.4 |
| Capital Expenditure, % | -0.60762 | -2.93 | -2.82 | -3.75 | -1.94 | -2.41 | -2.41 | -2.41 | -2.41 | -2.41 |
| Tax Rate, % | 94.73 | 94.73 | 94.73 | 94.73 | 94.73 | 94.73 | 94.73 | 94.73 | 94.73 | 94.73 |
| EBITAT | -28.9 | -59.7 | -61.6 | -63.7 | -4.5 | -66.9 | -76.4 | -87.3 | -99.7 | -114.0 |
| Depreciation | ||||||||||
| Changes in Account Receivables | ||||||||||
| Changes in Inventories | ||||||||||
| Changes in Accounts Payable | ||||||||||
| Capital Expenditure | ||||||||||
| UFCF | -71.9 | -58.9 | -53.4 | -13.4 | 20.5 | -78.2 | -60.2 | -68.8 | -78.6 | -89.8 |
| WACC, % | 8.75 | 8.72 | 8.71 | 8.71 | 8.03 | 8.59 | 8.59 | 8.59 | 8.59 | 8.59 |
| PV UFCF | ||||||||||
| SUM PV UFCF | -292.8 | |||||||||
| Long Term Growth Rate, % | 2.00 | |||||||||
| Free cash flow (T + 1) | -92 | |||||||||
| Terminal Value | -1,391 | |||||||||
| Present Terminal Value | -921 | |||||||||
| Enterprise Value | -1,214 | |||||||||
| Net Debt | 269 | |||||||||
| Equity Value | -1,482 | |||||||||
| Diluted Shares Outstanding, MM | 34 | |||||||||
| Equity Value Per Share | -43.40 |
What You Will Get
- Editable Forecast Inputs: Easily modify assumptions (growth %, margins, WACC) to explore various scenarios.
- Real-World Data: PAR Technology Corporation’s financial data pre-filled to facilitate your analysis.
- Automatic DCF Outputs: The template computes Net Present Value (NPV) and intrinsic value for you.
- Customizable and Professional: A refined Excel model that adjusts to your valuation requirements.
- Built for Analysts and Investors: Perfect for testing projections, validating strategies, and enhancing efficiency.
Key Features
- 🔍 Real-Life PAR Financials: Pre-filled historical and projected data for PAR Technology Corporation (PAR).
- ✏️ Fully Customizable Inputs: Adjust all critical parameters (yellow cells) like WACC, growth %, and tax rates.
- 📊 Professional DCF Valuation: Built-in formulas calculate PAR’s intrinsic value using the Discounted Cash Flow method.
- ⚡ Instant Results: Visualize PAR’s valuation instantly after making changes.
- Scenario Analysis: Test and compare outcomes for various financial assumptions side-by-side.
How It Works
- Download the Template: Gain immediate access to the Excel-based PAR DCF Calculator.
- Input Your Assumptions: Modify the yellow-highlighted cells for growth rates, WACC, margins, and more.
- Instant Calculations: The model automatically recalculates PAR Technology Corporation’s intrinsic value.
- Test Scenarios: Experiment with various assumptions to assess potential valuation changes.
- Analyze and Decide: Utilize the results to inform your investment or financial analysis.
Why Choose This Calculator for PAR Technology Corporation (PAR)?
- Accurate Data: Access real PAR Technology financials for trustworthy valuation outcomes.
- Customizable: Tailor key inputs such as growth rates, WACC, and tax rates to fit your forecasts.
- Time-Saving: Ready-to-use calculations save you the hassle of building from the ground up.
- Professional-Grade Tool: Crafted for investors, analysts, and consultants focused on PAR.
- User-Friendly: Easy-to-navigate design and clear instructions cater to all user levels.
Who Should Use This Product?
- Investors: Accurately assess PAR Technology Corporation’s (PAR) fair value before making investment choices.
- CFOs: Utilize a professional-grade DCF model for financial reporting and analysis specific to PAR.
- Consultants: Efficiently modify the template for valuation reports tailored to PAR's clients.
- Entrepreneurs: Acquire insights into financial modeling practices employed by leading technology firms like PAR.
- Educators: Implement it as a teaching resource to illustrate valuation methodologies relevant to PAR.
What the Template Contains
- Comprehensive DCF Model: Editable template with detailed valuation calculations tailored for PAR Technology Corporation (PAR).
- Real-World Data: PAR's historical and projected financials preloaded for in-depth analysis.
- Customizable Parameters: Adjust WACC, growth rates, and tax assumptions to explore various scenarios.
- Financial Statements: Complete annual and quarterly breakdowns for enhanced insights into PAR's performance.
- Key Ratios: Built-in analysis for profitability, efficiency, and leverage specific to PAR.
- Dashboard with Visual Outputs: Charts and tables designed for clear, actionable results regarding PAR Technology Corporation (PAR).
Disclaimer
All information, articles, and product details provided on this website are for general informational and educational purposes only. We do not claim any ownership over, nor do we intend to infringe upon, any trademarks, copyrights, logos, brand names, or other intellectual property mentioned or depicted on this site. Such intellectual property remains the property of its respective owners, and any references here are made solely for identification or informational purposes, without implying any affiliation, endorsement, or partnership.
We make no representations or warranties, express or implied, regarding the accuracy, completeness, or suitability of any content or products presented. Nothing on this website should be construed as legal, tax, investment, financial, medical, or other professional advice. In addition, no part of this site—including articles or product references—constitutes a solicitation, recommendation, endorsement, advertisement, or offer to buy or sell any securities, franchises, or other financial instruments, particularly in jurisdictions where such activity would be unlawful.
All content is of a general nature and may not address the specific circumstances of any individual or entity. It is not a substitute for professional advice or services. Any actions you take based on the information provided here are strictly at your own risk. You accept full responsibility for any decisions or outcomes arising from your use of this website and agree to release us from any liability in connection with your use of, or reliance upon, the content or products found herein.