
|
Patanjali Foods Limited (PATANJALI.NS) DCF Valuation |
Fully Editable: Tailor To Your Needs In Excel Or Sheets
Professional Design: Trusted, Industry-Standard Templates
Investor-Approved Valuation Models
MAC/PC Compatible, Fully Unlocked
No Expertise Is Needed; Easy To Follow
Patanjali Foods Limited (PATANJALI.NS) Bundle
Evaluate Patanjali Foods Limited's financial prospects with expertise! This (PATANJALINS) DCF Calculator provides pre-filled financial data along with the flexibility to modify revenue growth, WACC, margins, and other essential assumptions to align with your forecasts.
What You Will Receive
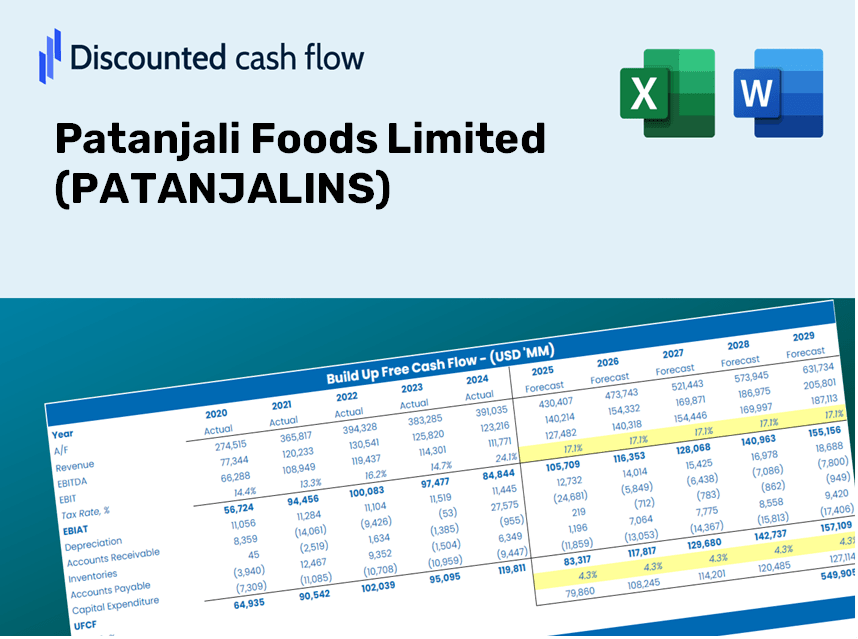
- Authentic Patanjali Data: Preloaded financial metrics – from revenue to EBIT – based on real and projected values.
- Complete Customization: Modify all essential parameters (yellow cells) such as WACC, growth %, and tax rates.
- Immediate Valuation Updates: Automatic recalculations to assess the effects of changes on Patanjali Foods Limited’s fair value.
- Flexible Excel Template: Designed for quick adjustments, scenario analysis, and comprehensive forecasts.
- Efficient and Accurate: Bypass the need to build models from the ground up while ensuring accuracy and adaptability.
Key Features
- Authentic Patanjali Financials: Gain access to precise pre-loaded historical data and future forecasts.
- Adjustable Forecast Inputs: Modify the highlighted cells for WACC, growth rates, and profit margins.
- Real-Time Calculations: Automatic updates for DCF, Net Present Value (NPV), and cash flow assessments.
- Engaging Visual Dashboard: User-friendly charts and summaries to help you understand your valuation outcomes.
- Suitable for All Skill Levels: An intuitive design tailored for investors, CFOs, and consultants alike.
How It Operates
- Step 1: Download the Excel spreadsheet.
- Step 2: Examine Patanjali Foods Limited’s pre-populated financial data and projections.
- Step 3: Adjust key variables such as revenue growth, WACC, and tax rates (highlighted cells).
- Step 4: Observe the DCF model refresh immediately as you modify your assumptions.
- Step 5: Evaluate the results and leverage them for investment strategies.
Why Opt for This Calculator?
- User-Friendly Interface: Tailored for both novices and seasoned users.
- Customizable Inputs: Easily adjust parameters to suit your analysis.
- Real-Time Adjustments: Observe instant changes to Patanjali Foods Limited’s valuation as you modify inputs.
- Preloaded Financial Data: Comes equipped with Patanjali Foods Limited’s actual financial figures for swift analysis.
- Relied Upon by Experts: Utilized by investors and analysts for making well-informed decisions.
Who Should Use This Product?
- Investors: Evaluate Patanjali Foods Limited’s (PATANJALINS) valuation before making trading decisions.
- CFOs and Financial Analysts: Optimize valuation procedures and assess future projections.
- Startup Founders: Discover how leading companies like Patanjali Foods Limited are valued in the market.
- Consultants: Provide clients with comprehensive valuation reports for informed decision-making.
- Students and Educators: Utilize real-world data from Patanjali Foods Limited to learn and teach valuation methods.
Contents of the Template
- Pre-Filled Data: Contains historical financials and forecasts for Patanjali Foods Limited (PATANJALINS).
- Discounted Cash Flow Model: An editable DCF valuation model featuring automatic calculations.
- Weighted Average Cost of Capital (WACC): A specific sheet designed for WACC calculations based on customized inputs.
- Key Financial Ratios: Evaluate Patanjali Foods' profitability, efficiency, and leverage.
- Customizable Inputs: Easily modify revenue growth, margins, and tax rates.
- Clear Dashboard: Visuals and tables that summarize essential valuation outcomes.
Disclaimer
All information, articles, and product details provided on this website are for general informational and educational purposes only. We do not claim any ownership over, nor do we intend to infringe upon, any trademarks, copyrights, logos, brand names, or other intellectual property mentioned or depicted on this site. Such intellectual property remains the property of its respective owners, and any references here are made solely for identification or informational purposes, without implying any affiliation, endorsement, or partnership.
We make no representations or warranties, express or implied, regarding the accuracy, completeness, or suitability of any content or products presented. Nothing on this website should be construed as legal, tax, investment, financial, medical, or other professional advice. In addition, no part of this site—including articles or product references—constitutes a solicitation, recommendation, endorsement, advertisement, or offer to buy or sell any securities, franchises, or other financial instruments, particularly in jurisdictions where such activity would be unlawful.
All content is of a general nature and may not address the specific circumstances of any individual or entity. It is not a substitute for professional advice or services. Any actions you take based on the information provided here are strictly at your own risk. You accept full responsibility for any decisions or outcomes arising from your use of this website and agree to release us from any liability in connection with your use of, or reliance upon, the content or products found herein.