
|
Parker-Hannifin Corporation (PH): ANSOFF MATRIX [Apr-2026 Updated] |
Fully Editable: Tailor To Your Needs In Excel Or Sheets
Professional Design: Trusted, Industry-Standard Templates
Investor-Approved Valuation Models
MAC/PC Compatible, Fully Unlocked
No Expertise Is Needed; Easy To Follow
Parker-Hannifin Corporation (PH) Bundle
You're looking at a powerhouse like Parker-Hannifin Corporation (PH) and wondering exactly how they plan to grow from their strong $19.9 billion fiscal 2025 foundation. Honestly, it's not just one path; they've clearly mapped out a four-pronged strategy using the classic Ansoff Matrix, balancing safe bets with aggressive expansion. We see them planning to gain share in soft industrial markets, push proven aerospace tech into new international defense sectors, launch electrified pumps for current customers, and make major moves like the Filtration Group acquisition to enter new aftermarket segments. With $3.8 billion in operating cash flow ready to deploy, this plan shows precisely where the near-term opportunities and calculated risks lie. Dive in below to see the concrete actions driving each quadrant of their growth map.
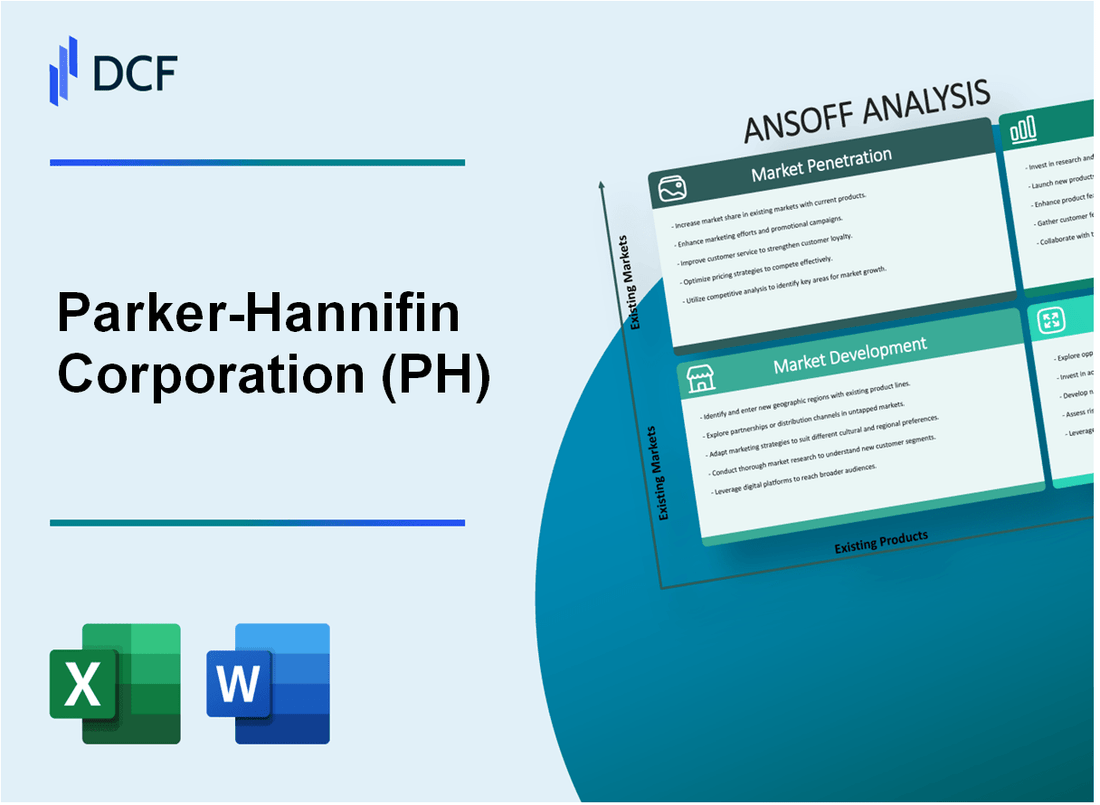
Parker-Hannifin Corporation (PH) - Ansoff Matrix: Market Penetration
Market Penetration focuses on increasing market share within existing markets using current products and services. For Parker-Hannifin Corporation (PH), this means driving deeper into established customer bases and capturing more wallet share from competitors.
A key driver for this strategy is the performance in Aerospace. You are pushing to increase aftermarket service revenue, building on strong prior results. For the full fiscal 2025 year, Aerospace Systems saw organic sales growth of 13%. Looking into the new fiscal year, the momentum continued, with Aerospace Systems revenues surging 13.3% year-over-year in fiscal Q1 2026 (ended September 2025).
The execution engine for this penetration is The Win Strategy™. This business system is central to driving operational excellence and margin improvement across the board. The success of this focus is visible in the final fiscal 2025 numbers, where Parker-Hannifin achieved a record adjusted segment operating margin of 26.1%. This operational discipline helps fund competitive actions in softer areas.
To capture more business from current relationships, the plan involves aggressively cross-selling the full portfolio to existing customers. The focus here is maximizing the value derived from established accounts, even as you target competitor accounts in the North American Diversified Industrial space, which showed only 2% order growth in Q4 2025. To be fair, that segment saw a 6.9% decline in sales for North America businesses over the full fiscal 2025 year, making targeted account acquisition a necessary action.
Funding these deeper channel incentives for core components is supported by significant internal capital generation. Parker-Hannifin generated record cash flow from operations of $3.8 billion in fiscal 2025. This substantial cash position, which represented 19.0% of sales, provides the financial muscle for aggressive market moves.
Here are some key financial metrics from the fiscal 2025 performance that underpin this market penetration effort:
| Metric | Fiscal 2025 Amount | Comparison/Context |
| Total Sales | $19.9 billion | Organic sales growth of 1% |
| Operating Cash Flow | $3.8 billion | Increased 12% over prior year |
| Net Income | $3.5 billion | Increase of 24% |
| Aerospace Systems Sales | $6.2 billion (implied total) | Organic growth of 13% for the year |
| Total Backlog | $11.0 billion | As of June 30, 2025 |
The actions supporting Market Penetration involve several tactical focuses:
- Drive Aerospace aftermarket service revenue growth, building on the 13% organic sales increase in fiscal 2025.
- Apply The Win Strategy™ to gain share, evidenced by the 26.1% record adjusted segment operating margin achieved in fiscal 2025.
- Deploy the $3.8 billion in operating cash flow to support channel incentives.
- Focus sales efforts on competitor accounts in North American Diversified Industrial, where Q4 2025 orders grew by 2%.
You're also working to deepen relationships with the existing customer base. The goal is to increase the number of technologies purchased per customer, recognizing that a significant portion of your current customers already utilize four or more of Parker-Hannifin Corporation's technology offerings.
Parker-Hannifin Corporation (PH) - Ansoff Matrix: Market Development
Market Development for Parker-Hannifin Corporation centers on taking established, proven technologies into new geographic territories or new end-market applications globally. This strategy is particularly relevant when existing core markets show signs of softening, as seen in some domestic industrial areas.
The company's overall performance in fiscal year 2025 shows total sales of $19.9 billion, with a 1% organic sales growth for the full year. You can see how the segments performed in the fourth quarter of fiscal 2025:
| Metric | Diversified Industrial - North America (Q4 FY25) | Diversified Industrial - International (Q4 FY25) | Aerospace Systems (Q4 FY25) |
| Sales (in millions) | $2,080 | $1,490 | $1,676 |
| Sales Change YoY | -6.9% | +4.3% | +9.7% |
| Organic Sales Change YoY | -1.4% | +0.6% | +8.6% |
| Adjusted Segment Operating Margin | 24.7% | 24.7% | 29.0% |
Here are the specific market development thrusts:
- - Expand core hydraulic and pneumatic product sales into high-growth, non-traditional emerging international regions.
- - Introduce proven aerospace fluid control systems to new international defense and military end markets.
- - Push existing industrial filtration products into new geographic regions, especially where the Diversified Industrial segment is currently soft.
- - Establish new distribution partnerships in Southeast Asia for existing motion and control technologies.
- - Apply current sealing and shielding products to new, non-core transportation infrastructure projects globally.
For the first point, while Parker-Hannifin Corporation has 40% of its business outside the U.S., the international Diversified Industrial order rates were flat year-over-year in the fourth quarter of fiscal 2025. Still, international Diversified Industrial sales did grow by 4.3% year-over-year in that same quarter.
Regarding aerospace fluid control systems, the Aerospace Systems Segment sales in the fourth quarter of fiscal 2025 hit $1.68 billion. Order rates for this segment jumped 12% year-over-year in Q4 FY2025, supported by strength in both commercial and defense channels. The global Aerospace Defense Fluid Conveyance Systems market was valued at $3514.5 million in 2024.
To address softness where the Diversified Industrial segment is weak-North America sales fell 6.9% in Q4 FY2025-Parker-Hannifin Corporation announced the acquisition of Filtration Group Corporation for $9.25 billion. This target is expected to bring in $2 billion in calendar year 2025 sales and is projected to increase Parker Filtration aftermarket sales by 500 basis points (bps). The deal is expected to generate $220 million in cost synergies.
For establishing new distribution in Southeast Asia, Parker-Hannifin Corporation already supports its global reach with a network of 17,100 independent distributors. In the third quarter of fiscal 2025, order rates in the APAC region were up 6%.
Applying products to new transportation infrastructure projects globally involves targeting the transportation market vertical, which was forecasted to decline in the low single digits in fiscal 2025.
Parker-Hannifin Corporation (PH) - Ansoff Matrix: Product Development
You're looking at how Parker-Hannifin Corporation is bringing new technology to its existing customer base, which is the core of Product Development in the Ansoff Matrix. This isn't just about tweaking; it's about integrating major new capabilities, like the recent acquisition in the electrification space.
The overall financial backdrop for fiscal year 2025 shows a company generating significant cash flow while deploying capital for strategic growth. For the fiscal year ended June 30, 2025, Parker-Hannifin reported net sales of $19.9 billion and net income of $3.5 billion.
Here's a quick look at the top-line performance for fiscal 2025:
| Metric | Value |
| Net Sales (FY2025) | $19.9 billion |
| Organic Sales Growth (FY2025) | 1% |
| Cash Flow from Operations (FY2025) | $3.8 billion |
| Debt Reduction (FY2025) | $1.3 billion |
| Shares Repurchased (FY2025) | $1.6 billion |
The strategy involves integrating the newly acquired Curtis Instruments' motor speed controllers into existing industrial equipment for hybrid solutions. Parker-Hannifin completed the acquisition of Curtis Instruments, Inc. in September 2025 for approximately $1.0 billion in cash. Curtis is projected to generate approximately $320 million in sales for calendar year 2025. This move directly enhances Parker-Hannifin's industrial electrification platform, which serves existing in-plant and industrial equipment customers.
For current off-highway markets transitioning to electric power, Parker-Hannifin launched new bent axis pumps, the F1e/F12e series, optimized for electrification and variable speed drive applications. These pumps are engineered to deliver substantial performance improvements over previous designs:
- Noise reduction of <-6 dBA.
- Pressure pulsation reduction of -40 %.
- The F12e series offers a maximum continuous operating pressure of 450 bar.
- The F1e series offers a maximum continuous operating pressure of 350 bar.
To support existing energy customers, Parker-Hannifin is introducing new cryogenic proportional relief valves designed for efficient boil-off gas management in hydrogen and LNG tanks. While specific launch revenue isn't public, this targets a market with significant scale. The global cryogenic valves market size was valued at USD 3.63 billion in 2024 and is projected to reach USD 3.87 billion in 2025, growing at a CAGR of 6.9% through 2030. The oil & gas end-use segment, a key customer base for these valves, held a 42.8% revenue share in 2024.
The commitment to enhancing existing product performance through digitalization and IoT is supported by the company's overall financial health, which allowed for a 10% increase in the quarterly cash dividend in April 2025, marking 69 consecutive fiscal years of annual dividend increases.
Finance: draft 13-week cash view by Friday.
Parker-Hannifin Corporation (PH) - Ansoff Matrix: Diversification
You're looking at Parker-Hannifin Corporation's aggressive push into new markets and technologies, which is classic diversification on the Ansoff Matrix. This isn't just about tweaking existing products; it's about entering entirely new spaces to reshape the portfolio.
The completion of the $9.25 billion Filtration Group acquisition is a massive step here. This deal, which Parker-Hannifin announced on November 11, 2025, is set to create one of the largest global industrial filtration businesses. Filtration Group is projected to generate $2 billion in sales for calendar year 2025, boasting an adjusted EBITDA margin of 23.5%. What's key for diversification is that approximately 85% of Filtration Group's sales come from the aftermarket, establishing strong, recurring revenue streams in the Life Sciences, HVAC/R, and Industrial segments. This acquisition is Parker-Hannifin's second-largest ever, behind the $9.8 billion Meggitt acquisition in 2022.
To enter new electric vehicle sub-markets, Parker-Hannifin completed the acquisition of Curtis Instruments for approximately $1 billion in cash on September 18, 2025. Curtis expects calendar year 2025 sales of roughly $320 million. This move directly targets material handling and off-highway environments by adding complementary power electronics and control solutions to Parker-Hannifin's existing electrification platform. For context, in fiscal 2025, Parker-Hannifin deployed capital by announcing this $1.0 billion deal, reducing debt by $1.3 billion, and repurchasing $1.6 billion of shares.
Parker-Hannifin continues to pursue bolt-on acquisitions specifically in long-cycle, high-margin technology areas. This strategy is designed to improve the overall revenue mix, which is already benefiting from the strategic shift toward longer-cycle products. The company's fiscal 2025 results showed net sales of $19.85 billion and an operating cash flow of a record $3.8 billion, or 19.0% of sales, giving it the financial muscle for these targeted additions.
In the digital realm, Parker-Hannifin is integrating advanced digital tools across its operations. The company is building a more agile supply chain using digital tools such as AI forecasting and predictive analytics. Furthermore, its 'Voice of the Machine' IoT platform reinforces its leadership in predictive maintenance technologies, which is a clear move into new service-based revenue streams within infrastructure markets.
The focus on emerging clean energy is evident in the work being done for hydrogen. Parker-Hannifin experts are actively engaged in addressing the challenges of hydrogen's ramp-up scale across production, distribution, and usage. The opportunities identified span technologies for gas production, distribution, and use in fuel cells or carbon capture from production processes. This is a significant area of focus, as the company works to be ready for the global decarbonization deadlines set for 2030 and 2050.
| Acquisition/Investment Area | Financial/Statistical Metric | Value/Figure |
|---|---|---|
| Filtration Group Acquisition | Cash Purchase Price | $9.25 billion |
| Filtration Group Acquisition | Projected CY 2025 Sales | $2 billion |
| Filtration Group Acquisition | Expected Pre-Tax Cost Synergies (by Year 3) | $220 million |
| Curtis Instruments Acquisition | Cash Purchase Price | Approx. $1 billion |
| Curtis Instruments Acquisition | Expected CY 2025 Sales | Approx. $320 million |
| Parker-Hannifin FY 2025 Performance | Net Sales | $19.85 billion |
| Parker-Hannifin FY 2025 Performance | Cash Flow from Operations | $3.8 billion |
| Parker-Hannifin Shareholder Return | Consecutive Annual Dividend Increases | 69 fiscal years |
If you're tracking the impact of these moves, note that Parker-Hannifin's fiscal 2025 adjusted EPS hit a record of $27.33. Finance: draft 13-week cash view by Friday.
Disclaimer
All information, articles, and product details provided on this website are for general informational and educational purposes only. We do not claim any ownership over, nor do we intend to infringe upon, any trademarks, copyrights, logos, brand names, or other intellectual property mentioned or depicted on this site. Such intellectual property remains the property of its respective owners, and any references here are made solely for identification or informational purposes, without implying any affiliation, endorsement, or partnership.
We make no representations or warranties, express or implied, regarding the accuracy, completeness, or suitability of any content or products presented. Nothing on this website should be construed as legal, tax, investment, financial, medical, or other professional advice. In addition, no part of this site—including articles or product references—constitutes a solicitation, recommendation, endorsement, advertisement, or offer to buy or sell any securities, franchises, or other financial instruments, particularly in jurisdictions where such activity would be unlawful.
All content is of a general nature and may not address the specific circumstances of any individual or entity. It is not a substitute for professional advice or services. Any actions you take based on the information provided here are strictly at your own risk. You accept full responsibility for any decisions or outcomes arising from your use of this website and agree to release us from any liability in connection with your use of, or reliance upon, the content or products found herein.