
|
Phathom Pharmaceuticals, Inc. (PHAT) DCF Valuation |
Fully Editable: Tailor To Your Needs In Excel Or Sheets
Professional Design: Trusted, Industry-Standard Templates
Investor-Approved Valuation Models
MAC/PC Compatible, Fully Unlocked
No Expertise Is Needed; Easy To Follow
Phathom Pharmaceuticals, Inc. (PHAT) Bundle
Discover the true potential of Phathom Pharmaceuticals, Inc. (PHAT) with our advanced DCF Calculator! Adjust key assumptions, explore various scenarios, and evaluate how changes affect Phathom's valuation – all within a single Excel template.
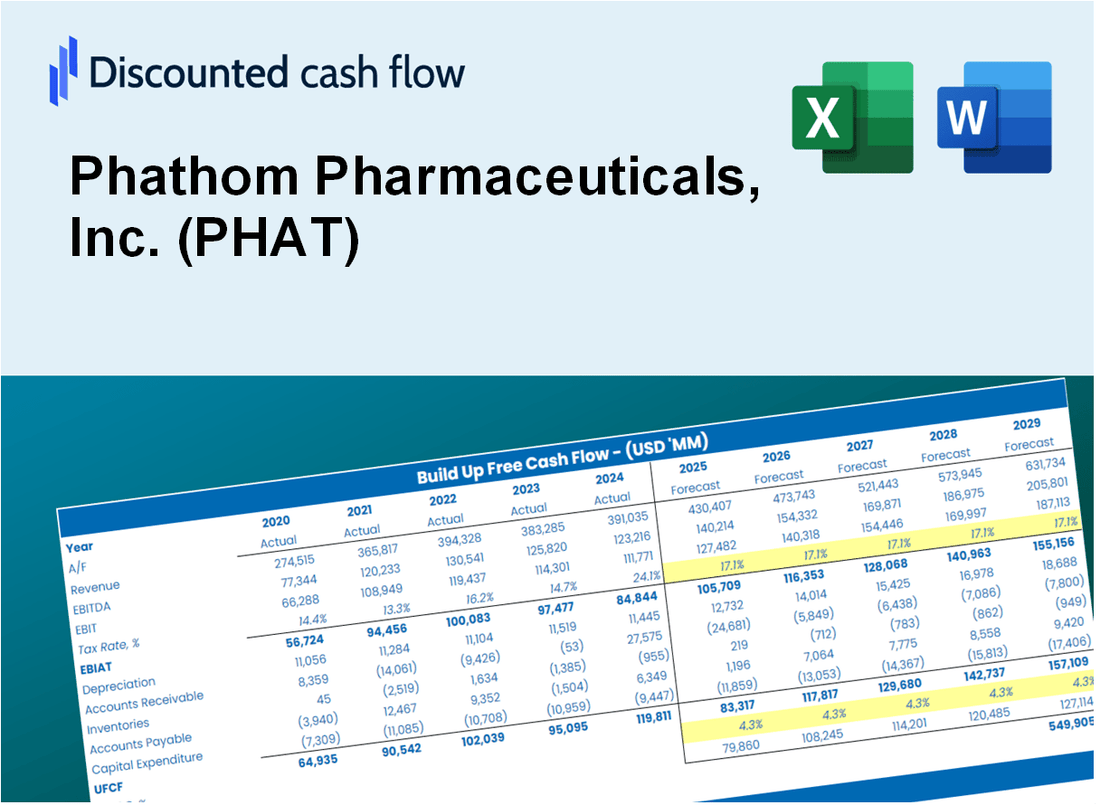
Discounted Cash Flow (DCF) - (USD MM)
| Year | AY1 2020 |
AY2 2021 |
AY3 2022 |
AY4 2023 |
AY5 2024 |
FY1 2025 |
FY2 2026 |
FY3 2027 |
FY4 2028 |
FY5 2029 |
|---|---|---|---|---|---|---|---|---|---|---|
| Revenue | .0 | .0 | .0 | .7 | 55.3 | 69.1 | 86.3 | 107.9 | 134.9 | 168.6 |
| Revenue Growth, % | 0 | 0 | 0 | 0 | 8001.47 | 25 | 25 | 25 | 25 | 25 |
| EBITDA | -124.2 | -134.6 | -171.8 | -159.0 | -261.5 | 13.8 | 17.3 | 21.6 | 27.0 | 33.7 |
| EBITDA, % | 100 | 100 | 100 | -23320.97 | -473.33 | 20 | 20 | 20 | 20 | 20 |
| Depreciation | .3 | .5 | .6 | .6 | .8 | 53.3 | 66.6 | 83.3 | 104.1 | 130.1 |
| Depreciation, % | 100 | 100 | 100 | 84.31 | 1.44 | 77.15 | 77.15 | 77.15 | 77.15 | 77.15 |
| EBIT | -124.5 | -135.1 | -172.4 | -159.6 | -262.3 | 13.8 | 17.3 | 21.6 | 27.0 | 33.7 |
| EBIT, % | 100 | 100 | 100 | -23405.28 | -474.76 | 20 | 20 | 20 | 20 | 20 |
| Total Cash | 287.5 | 183.3 | 155.4 | 381.4 | 297.3 | 69.1 | 86.3 | 107.9 | 134.9 | 168.6 |
| Total Cash, percent | .0 | .0 | .0 | .1 | .0 | .0 | .0 | .0 | .0 | .0 |
| Account Receivables | .1 | .0 | .0 | 1.6 | 38.8 | 65.0 | 81.2 | 101.5 | 126.9 | 158.6 |
| Account Receivables, % | 100 | 100 | 100 | 240.03 | 70.22 | 94.04 | 94.04 | 94.04 | 94.04 | 94.04 |
| Inventories | -.1 | .0 | .0 | 1.2 | 3.2 | 56.1 | 70.1 | 87.6 | 109.5 | 136.9 |
| Inventories, % | 100 | 100 | 100 | 177.13 | 5.81 | 81.16 | 81.16 | 81.16 | 81.16 | 81.16 |
| Accounts Payable | 16.8 | 5.2 | 10.0 | 12.6 | 10.5 | 57.9 | 72.3 | 90.4 | 113.0 | 141.3 |
| Accounts Payable, % | 100 | 100 | 100 | 1847.65 | 19.02 | 83.8 | 83.8 | 83.8 | 83.8 | 83.8 |
| Capital Expenditure | -1.0 | -.3 | -1.0 | -1.6 | .0 | -13.8 | -17.3 | -21.6 | -27.0 | -33.7 |
| Capital Expenditure, % | 100 | 100 | 100 | -239.59 | 0 | -20 | -20 | -20 | -20 | -20 |
| Tax Rate, % | 0 | 0 | 0 | 0 | 0 | 0 | 0 | 0 | 0 | 0 |
| EBITAT | -128.6 | -139.0 | -194.5 | -159.6 | -262.3 | 13.8 | 17.3 | 21.6 | 27.0 | 33.7 |
| Depreciation | ||||||||||
| Changes in Account Receivables | ||||||||||
| Changes in Inventories | ||||||||||
| Changes in Accounts Payable | ||||||||||
| Capital Expenditure | ||||||||||
| UFCF | -112.5 | -150.5 | -190.1 | -160.9 | -302.8 | 21.7 | 50.8 | 63.5 | 79.4 | 99.3 |
| WACC, % | 8.91 | 8.91 | 8.91 | 8.91 | 8.91 | 8.91 | 8.91 | 8.91 | 8.91 | 8.91 |
| PV UFCF | ||||||||||
| SUM PV UFCF | 233.1 | |||||||||
| Long Term Growth Rate, % | 2.00 | |||||||||
| Free cash flow (T + 1) | 101 | |||||||||
| Terminal Value | 1,465 | |||||||||
| Present Terminal Value | 956 | |||||||||
| Enterprise Value | 1,189 | |||||||||
| Net Debt | -95 | |||||||||
| Equity Value | 1,284 | |||||||||
| Diluted Shares Outstanding, MM | 63 | |||||||||
| Equity Value Per Share | 20.33 |
What You Will Get
- Pre-Filled Financial Model: Phathom Pharmaceuticals’ actual data enables precise DCF valuation.
- Full Forecast Control: Adjust revenue growth, margins, WACC, and other key drivers tailored for [PHAT].
- Instant Calculations: Automatic updates ensure you see results as you make changes to your [PHAT] model.
- Investor-Ready Template: A refined Excel file designed for professional-grade valuation of [PHAT].
- Customizable and Reusable: Tailored for flexibility, allowing repeated use for detailed forecasts on [PHAT].
Key Features
- Customizable Financial Metrics: Adjust essential inputs such as revenue projections, R&D spending, and operational costs.
- Instant DCF Valuation: Quickly computes intrinsic value, net present value, and additional financial metrics.
- High-Precision Analysis: Incorporates Phathom Pharmaceuticals’ actual financial data for accurate valuation results.
- Streamlined Scenario Testing: Easily evaluate various assumptions and analyze different outcomes.
- Efficiency Booster: Remove the hassle of creating intricate valuation models from the ground up.
How It Works
- Download: Access the ready-to-use Excel file with Phathom Pharmaceuticals' (PHAT) financial data.
- Customize: Adjust forecasts, including revenue growth, EBITDA %, and WACC.
- Update Automatically: The intrinsic value and NPV calculations update in real-time.
- Test Scenarios: Create multiple projections and compare outcomes instantly.
- Make Decisions: Use the valuation results to guide your investment strategy.
Why Choose Phathom Pharmaceuticals, Inc. (PHAT)?
- Innovative Solutions: Cutting-edge therapies designed to address unmet medical needs.
- Proven Expertise: A team of experienced professionals dedicated to advancing healthcare.
- Robust Pipeline: A diverse range of products in various stages of development.
- Commitment to Quality: Adherence to the highest standards in research and production.
- Positive Impact: Focused on improving patient outcomes and quality of life.
Who Should Use This Product?
- Healthcare Investors: Construct comprehensive and accurate valuation models for portfolio assessments related to Phathom Pharmaceuticals, Inc. (PHAT).
- Corporate Finance Teams: Evaluate valuation scenarios to inform strategic decisions within the pharmaceutical sector.
- Consultants and Advisors: Deliver precise valuation insights for clients interested in Phathom Pharmaceuticals, Inc. (PHAT).
- Students and Educators: Utilize real-world data to enhance learning and practice in financial modeling within the biotech industry.
- Pharma Enthusiasts: Gain insights into how companies like Phathom Pharmaceuticals, Inc. (PHAT) are valued in the healthcare market.
What the Template Contains
- Preloaded PHAT Data: Historical and projected financial data, including revenue, EBIT, and capital expenditures.
- DCF and WACC Models: Professional-grade sheets for calculating intrinsic value and Weighted Average Cost of Capital.
- Editable Inputs: Yellow-highlighted cells for adjusting revenue growth, tax rates, and discount rates.
- Financial Statements: Comprehensive annual and quarterly financials for deeper analysis.
- Key Ratios: Profitability, leverage, and efficiency ratios to evaluate performance.
- Dashboard and Charts: Visual summaries of valuation outcomes and assumptions.
Disclaimer
All information, articles, and product details provided on this website are for general informational and educational purposes only. We do not claim any ownership over, nor do we intend to infringe upon, any trademarks, copyrights, logos, brand names, or other intellectual property mentioned or depicted on this site. Such intellectual property remains the property of its respective owners, and any references here are made solely for identification or informational purposes, without implying any affiliation, endorsement, or partnership.
We make no representations or warranties, express or implied, regarding the accuracy, completeness, or suitability of any content or products presented. Nothing on this website should be construed as legal, tax, investment, financial, medical, or other professional advice. In addition, no part of this site—including articles or product references—constitutes a solicitation, recommendation, endorsement, advertisement, or offer to buy or sell any securities, franchises, or other financial instruments, particularly in jurisdictions where such activity would be unlawful.
All content is of a general nature and may not address the specific circumstances of any individual or entity. It is not a substitute for professional advice or services. Any actions you take based on the information provided here are strictly at your own risk. You accept full responsibility for any decisions or outcomes arising from your use of this website and agree to release us from any liability in connection with your use of, or reliance upon, the content or products found herein.