
|
Park Hotels & Resorts Inc. (PK): ANSOFF MATRIX [Dec-2025 Updated] |
Fully Editable: Tailor To Your Needs In Excel Or Sheets
Professional Design: Trusted, Industry-Standard Templates
Investor-Approved Valuation Models
MAC/PC Compatible, Fully Unlocked
No Expertise Is Needed; Easy To Follow
Park Hotels & Resorts Inc. (PK) Bundle
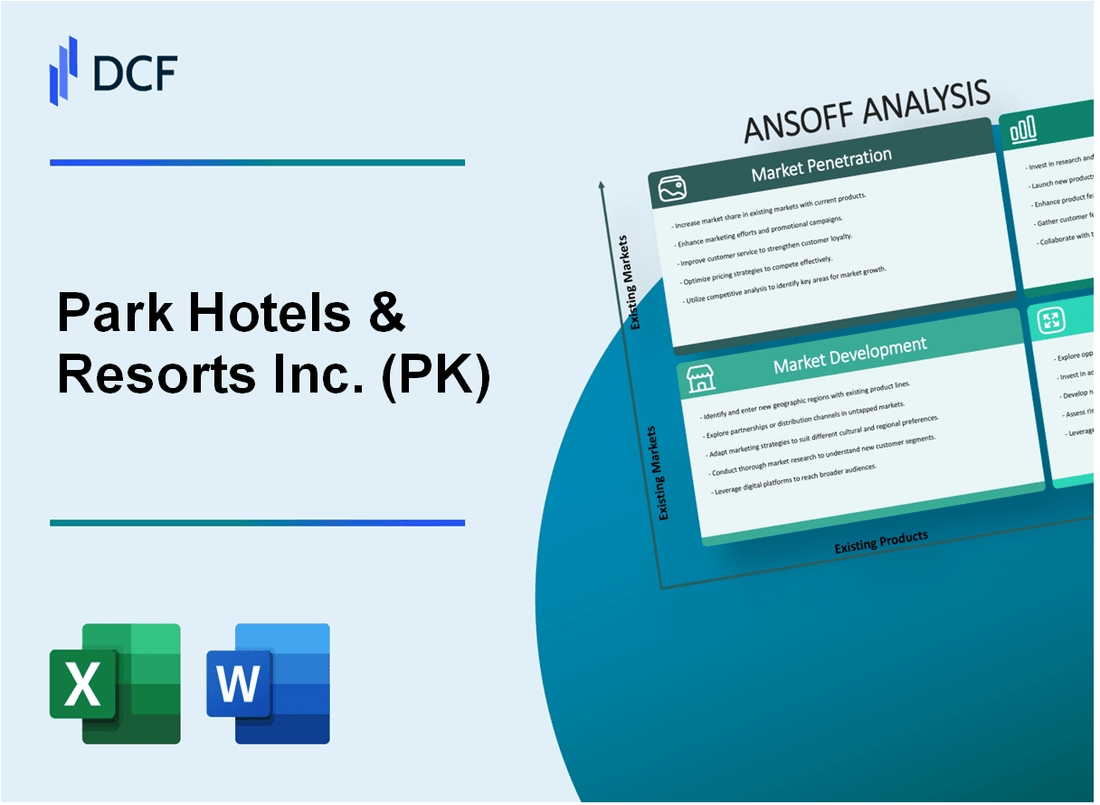
You're looking at Park Hotels & Resorts Inc. right now, and honestly, the Q3 2025 numbers-like that 4.7% comparable RevPAR decline-show the pressure they're under while managing major capital projects. As a lodging REIT focused on asset allocation, their path forward isn't about guesswork; it's about calculated moves, like divesting non-core assets for up to $400 million this year to fund high-return renovations. This Ansoff Matrix cuts straight through the noise, laying out exactly how Park Hotels & Resorts Inc. plans to grow, whether by squeezing more out of existing assets (Market Penetration) or making bold new bets (Diversification). Let's map out the strategy below.
Park Hotels & Resorts Inc. (PK) - Ansoff Matrix: Market Penetration
You're looking at how Park Hotels & Resorts Inc. (PK) can squeeze more revenue out of the properties it already owns. That's Market Penetration in a nutshell, and for Park Hotels & Resorts Inc. (PK), it's all about driving up rates and filling rooms at the existing portfolio.
Driving higher Revenue Per Available Room (RevPAR) at core assets is a major focus. For instance, the Hilton Hawaiian Village Waikiki Beach Resort is working to regain market share after late 2024 labor strikes. Management is forecasting a robust Q4 demand surge, with potential for the Hilton Hawaiian Village Waikiki Beach Resort to see increases as high as 57% in Q4 RevPAR, overcoming previous disruptions. Still, Q2 2025 Comparable RevPAR was reported at $195.68, a year-over-year decrease of (1.6)%.
In major urban centers, the strategy is shifting due to asset sales. Park Hotels & Resorts Inc. (PK) sold the 316-room Hyatt Centric Fisherman's Wharf in San Francisco for $80 million in 2025. The focus shifts to the remaining core assets, where group booking pace is a key driver. As of the end of March 2025, the Comparable Group Revenue Pace for 2025 was up over 1% compared to the end of March 2024, with average Comparable group rates projected to exceed 2024 rates by 4%. For Q4 2025, the anticipated boost in group demand could lead to a more than 12% increase in Comparable Group Revenue Pace.
Dynamic pricing models are used to capture that peak demand. For example, the company is working to capitalize on city-wide events. The Q1 2025 RevPAR was $178. The company's Q3 2025 revenue came in at $610M.
Capital investment is directly tied to capturing higher rate tiers. Park Hotels & Resorts Inc. (PK) outlined $310 million to $330 million in total capital improvements for 2025. This includes the $100 million renovation of Royal Palm South Beach, which management expects will double the hotel's EBITDA upon stabilization. Furthermore, Park Hotels & Resorts Inc. (PK) completed nearly $75 million in guestroom renovations at the Rainbow Tower at the Hilton Hawaiian Village Waikiki Beach Resort and the Palace Tower at the Hilton Waikoloa Village in Q1 2025. The Royal Palm South Beach renovation targets an internal rate of return (IRR) of 15% to 20%.
Optimizing distribution channels is about keeping more of what you earn. While specific 2025 direct booking percentages aren't public, the financial incentive is clear: third-party Online Travel Agencies (OTAs) commissions typically run between 15-25% or even up to 30%. Reducing reliance on these channels directly boosts the net revenue captured per room night.
Here's a quick look at some of the key operational and financial metrics driving this strategy:
| Metric | Value/Period | Reference Point/Context |
| Total 2025 Capital Improvements Budget | $310 million to $330 million | Full Year 2025 Guidance |
| Q1 2025 RevPAR | $178 | First Quarter 2025 Performance |
| Q2 2025 Comparable RevPAR | $195.68 | Second Quarter 2025 Performance |
| Q3 2025 Total Hotel Revenues | $610M | Third Quarter 2025 Results |
| Anticipated Q4 2025 Comparable Group Revenue Pace Increase | >12% | Q4 Outlook |
| Q1 2025 Capital Improvements Spend | Over $80 million | First Quarter 2025 Actual Spend |
| Royal Palm Renovation Expected IRR | 15% to 20% | Target Return on Investment |
The company is also actively reshaping its portfolio, which impacts the comparable base for these metrics. Park Hotels & Resorts Inc. (PK) sold the Hyatt Centric Fisherman's Wharf for $80 million in 2025. The Hilton San Francisco Union Square and Parc 55 were sold by a receiver in November 2025, following default on a $725 million loan.
The focus on existing assets is supported by internal performance indicators:
- Comparable Group Rates projected to exceed 2024 by 4% for 2025.
- Q1 2025 Adjusted FFO per share was $0.46.
- Q2 2025 Diluted Adjusted FFO per share was $0.64.
- Total Q1 hotel revenues were $608 million.
- Hotel Adjusted EBITDA margin remained strong at 29.6% in Q2 2025.
- Group revenues at Hilton Hawaiian Village saw a 77% increase year-over-year in one reported quarter, though transient revenue declined 14%.
Finance: review the Q4 2025 projected RevPAR against the full-year guidance range of -$184-$187 Comparable RevPAR.
Park Hotels & Resorts Inc. (PK) - Ansoff Matrix: Market Development
Market Development for Park Hotels & Resorts Inc. (PK) centers on deploying capital generated from portfolio optimization into new geographic areas or higher-barrier segments, moving beyond the current U.S. focus. The strategy is underpinned by a disciplined capital recycling program, as management believes development yields currently exceed acquisition yields.
The funding mechanism for this expansion is clearly tied to the ongoing disposition of non-core assets. Park Hotels & Resorts Inc. has a publicly stated goal to achieve between $300 million and $400 million in non-core dispositions by year end 2025. So far in 2025, the company successfully closed the sale of the 316-key Hyatt Centric Fisherman's Wharf for $80 million. This sale price represented a 64.0x multiple on the hotel's 2024 EBITDA. Since 2018, the company has disposed of 46 assets, generating proceeds north of $3 billion. The capital from these sales is intended to fund strategic reinvestments and expansion, as the company aims to concentrate its ownership across 20 high-quality assets, down from the 39 hotels with over 25,000 rooms as of September 30, 2025.
The current portfolio concentration highlights the need for geographic diversification. As of 2024, Hawaii accounted for approximately 30% of hotel-adjusted EBITDA, making it the largest market, though its Hotel Adjusted EBITDA declined to $45 million in Q2 2025 from $56 million in Q2 2024. Conversely, the urban portfolio, which includes markets like New York and Boston, saw a 3% increase in Comparable RevPAR in Q2 2025 year-over-year.
The strategic deployment of capital is currently heavily weighted toward high-ROI internal projects, which sets a benchmark for potential external returns. Park Hotels & Resorts Inc. has committed over $325 million in high ROI reinvestments across its best-performing assets, targeting returns approaching 20%. A key example is the $103 million renovation at the Royal Palm South Beach Miami, which is expected to more than double that hotel's EBITDA from $14 million to nearly $28 million upon stabilization. Total expected capital expenditures for 2025 are budgeted between $310 million and $330 million.
The Market Development thrust involves several distinct avenues:
- Acquire high-quality, full-service hotels in major European gateway cities, expanding the current US focus.
- Target new US Sunbelt markets with strong corporate relocation and leisure demand.
- Enter the luxury resort segment in established international destinations like the Caribbean or Mexico.
- Partner with established global hotel brands to co-invest in new, high-barrier-to-entry markets.
- Utilize capital from non-core asset sales to fund expansion into new, higher-growth geographic regions.
The capital recycling goal of $300 million to $400 million in dispositions for 2025 directly supports the funding of these new market entries. The company's focus on development over acquisition suggests that any new market entry would likely involve a ground-up development or a significant repositioning of an acquired asset, rather than a simple purchase of an existing stabilized property.
The luxury resort segment in Mexico is an area where affiliated brands are expanding, with a Park Hyatt Cancun slated for 2026 and a Park Hyatt Los Cabos expected to open late 2025. This signals brand activity in the target region, though these specific developments are associated with a different entity, Parks Hospitality Holdings.
The company's current portfolio composition as of Q3 2025:
| Metric | Value / Percentage | Period / Context |
| Total Portfolio Rooms | Over 25,000 rooms | As of September 30, 2025 |
| Luxury/Upper-Upscale Rooms | About 87% | As of September 30, 2025 |
| Core Portfolio Value Concentration | 90% | Assets Park Hotels & Resorts Inc. defines as core |
| Non-Core Hotels Remaining to Divest | 15 | Goal to concentrate ownership across 20 high-quality assets |
| Total Non-Core Asset Sales Goal (2025) | $300 million - $400 million | Stated goal for 2025 |
| Hyatt Centric Fisherman's Wharf Sale Price | $80 million | Q2 2025 Sale |
| Royal Palm Miami Renovation Budget | $103 million (Total) | As of June 2025, $25 million spent |
| Expected 2025 Capex | $310 million - $330 million | Total expected capital expenditures |
The ability to fund expansion is directly linked to the execution of the asset disposition plan, which is expected to generate proceeds to reduce debt or fund growth, given the current S&P Global Ratings lease-adjusted leverage is in the low-6.0x area for 2025.
Park Hotels & Resorts Inc. (PK) - Ansoff Matrix: Product Development
Park Hotels & Resorts Inc. is deploying capital toward enhancing its existing asset base, with total capital expenditures projected to total $310 million-$330 million in 2025. This investment strategy is supported by capital recycling efforts, including the plan to dispose of $300-$400 million of non-core assets during 2025.
The company reported that it deployed over $325 million across its best-performing assets, targeting returns approaching 20%. One specific example of this reinvestment is the transformative renovation at the Royal Palm South Beach Miami, a project valued at $100 million, with an expected internal rate of return of 15% to 20%.
The portfolio, as of September 30, 2025, consisted of 39 hotels and resorts with approximately 25,000 rooms, of which about 87% are luxury and upper-upscale.
The following table presents key financial metrics that provide context for the potential impact of new product offerings on overall hotel performance:
| Metric | Period/Date | Value |
| Total Hotel Revenues | Q2 2025 | $672 million |
| Hotel Adjusted EBITDA Margin | Q2 2025 | 29.6% |
| Comparable RevPAR | Q3 2025 | $180.93 |
| Full-Year RevPAR Guidance Change (Midpoint) | 2025 Forecast | -2% decline |
| Full-Year Adjusted EBITDA Forecast | 2025 Forecast | $608 million |
Strategic asset management actions taken in 2025 directly free up capital for product development initiatives:
- Reported the sale of the Hyatt Centric Fisherman's Wharf for $80 million.
- The sale of the Hyatt Centric Fisherman's Wharf achieved a multiple of 64x of 2024 EBITDA.
- Permanently closed the Embassy Suites Kansas City Plaza, which was projected to generate approximately $0.2 million of EBITDA during 2025.
- Net Debt as of March 31, 2025, was approximately $3.8 billion.
- Total liquidity was approximately $1.2 billion as of March 31, 2025.
The focus on high-ROI reinvestments supports the introduction of premium offerings:
- Capital deployed in high ROI projects targets returns approaching 20%.
- Comparable RevPAR in Orlando's Bonnet Creek complex grew nearly 3% in Q3 2025.
- Comparable Group Revenue Pace for Q4 2025 is projected to increase over 12% compared to Q4 2024.
Park Hotels & Resorts Inc. (PK) - Ansoff Matrix: Diversification
You're looking at Park Hotels & Resorts Inc. (PK) as a lodging REIT, and while their current focus is on portfolio optimization-selling non-core assets to fund high-return renovations-true diversification means looking beyond the core hotel business. This quadrant of the Ansoff Matrix explores moving into entirely new product/market combinations, which for Park means leveraging their real estate expertise into adjacent or financial sectors.
The company's current strategic pivot is clear: they are targeting the sale of $300 million to $400 million in non-core hotels in 2025. This capital recycling is meant to fund capital expenditures projected between $310 million and $330 million for the year. The goal is to concentrate on core assets, like the ongoing $103 million transformative renovation at the Royal Palm South Beach Miami, which is projected to double that hotel's EBITDA upon stabilization. With liquidity reaching $2.1 billion as of Q3 2025, Park has the dry powder to explore these new avenues.
Here is a look at potential financial metrics for these diversification moves, using current market data as a guide for potential returns and investment profiles:
| Diversification Strategy | Asset/Investment Type | Relevant 2025 Market Metric/Benchmark | Potential Return/Yield Profile |
| Acquire high-end, branded residential properties adjacent to existing hotel assets | Prime Residential Real Estate | Luxury Hotel Cap Rates: ~8.1% to 8.2% (August 2025) | Yields likely lower than hotel NOI, targeting 5.5% to 7.0% stabilized cap rate |
| Invest in a minority stake in a hotel management company | Hotel Management Fee Income | Typical Base Management Fee: 2.0% to 4.0% of total revenue | Income stream based on management fees, plus Incentive Fee hurdle at 8% to 12% AGOP return |
| Develop a separate, non-lodging real estate portfolio | Urban Office/Retail Space | Median Sold Office Cap Rate: 7.5% (March 2025) | Targeted stabilized cap rates in the 6.5% to 7.5% range |
| Launch a private equity fund focused on hotel debt or mezzanine financing | Hotel Mezzanine Debt | Mezzanine Debt Interest Rate: 10% to 14% cash coupon | Targeted Internal Rate of Return (IRR): 12% to 20% |
| Create a new, distinct luxury lifestyle hotel brand | Development Yields | Park's CEO belief: Can generate higher yields from development than acquisition | Yields expected to exceed current acquisition cap rates, potentially 9.5% to 11.0% on cost |
The move into branded residential properties adjacent to existing assets would leverage Park Hotels & Resorts Inc.'s deep understanding of high-end hospitality operations, but the returns would likely be valued on a real estate basis rather than an operating one. For instance, prime urban office cap rates were reported at 7.5% in March 2025, suggesting a high-end residential component might target a stabilized yield in the 6.0% to 7.0% range.
Capturing management fee income via a minority stake in a management company is a pure fee-based revenue stream, a significant departure from Park Hotels & Resorts Inc.'s asset-ownership model. The industry standard base fee is typically 3.0% of total operating revenue, with incentive fees kicking in once the owner achieves a return hurdle, often set between 8% and 12% of investment. This offers a high-margin, low-capital-intensity revenue source.
Developing a non-lodging portfolio, such as urban retail or office space, places Park Hotels & Resorts Inc. in direct competition with other commercial real estate players. The median sold office cap rate in March 2025 was 7.5%, indicating the price investors were willing to pay relative to Net Operating Income (NOI) for office assets. This would require a completely different leasing and asset management expertise set than their current premium-branded hotel portfolio, which as of September 30, 2025, stood at 38 to 39 properties.
Launching a private equity fund focused on hotel debt or mezzanine financing is a financial diversification. The private credit market was estimated at $1.5 trillion at the start of 2024 and is projected to reach $2.8 trillion by 2028. Mezzanine debt, being subordinated, commands higher returns, with typical cash interest coupons ranging from 10% to 14%, aiming for an Internal Rate of Return (IRR) between 12% and 20%. This would utilize Park Hotels & Resorts Inc.'s substantial liquidity, which stood at $2.1 billion in Q3 2025, to act as a capital provider rather than just a capital recipient or owner.
Finally, creating a new luxury lifestyle brand is an internal product development play that feeds into a market development strategy. Park Hotels & Resorts Inc.'s Chairman and CEO has expressed a strong belief that the company can generate higher yields from development projects than from acquisition projects at this point. This suggests that the internal hurdle rate for a self-developed brand would need to clear returns significantly higher than the current hotel cap rates, which for luxury segments were hovering around 8.1% to 8.2% in mid-2025.
- Park Hotels & Resorts Inc.'s net debt stood at approximately $3.7 billion in 2025.
- The company's 2025 capital expenditure budget is set between $310 million and $330 million.
- The Q2 2025 Adjusted EBITDA was $183 million.
- The company sold the 316-room Hyatt Centric Fisherman's Wharf for $80 million in Q2 2025.
Disclaimer
All information, articles, and product details provided on this website are for general informational and educational purposes only. We do not claim any ownership over, nor do we intend to infringe upon, any trademarks, copyrights, logos, brand names, or other intellectual property mentioned or depicted on this site. Such intellectual property remains the property of its respective owners, and any references here are made solely for identification or informational purposes, without implying any affiliation, endorsement, or partnership.
We make no representations or warranties, express or implied, regarding the accuracy, completeness, or suitability of any content or products presented. Nothing on this website should be construed as legal, tax, investment, financial, medical, or other professional advice. In addition, no part of this site—including articles or product references—constitutes a solicitation, recommendation, endorsement, advertisement, or offer to buy or sell any securities, franchises, or other financial instruments, particularly in jurisdictions where such activity would be unlawful.
All content is of a general nature and may not address the specific circumstances of any individual or entity. It is not a substitute for professional advice or services. Any actions you take based on the information provided here are strictly at your own risk. You accept full responsibility for any decisions or outcomes arising from your use of this website and agree to release us from any liability in connection with your use of, or reliance upon, the content or products found herein.