
|
Playa Hotels & Resorts N.V. (PLYA): ANSOFF Matrix Analysis [Jan-2025 Updated] |
Fully Editable: Tailor To Your Needs In Excel Or Sheets
Professional Design: Trusted, Industry-Standard Templates
Investor-Approved Valuation Models
MAC/PC Compatible, Fully Unlocked
No Expertise Is Needed; Easy To Follow
Playa Hotels & Resorts N.V. (PLYA) Bundle
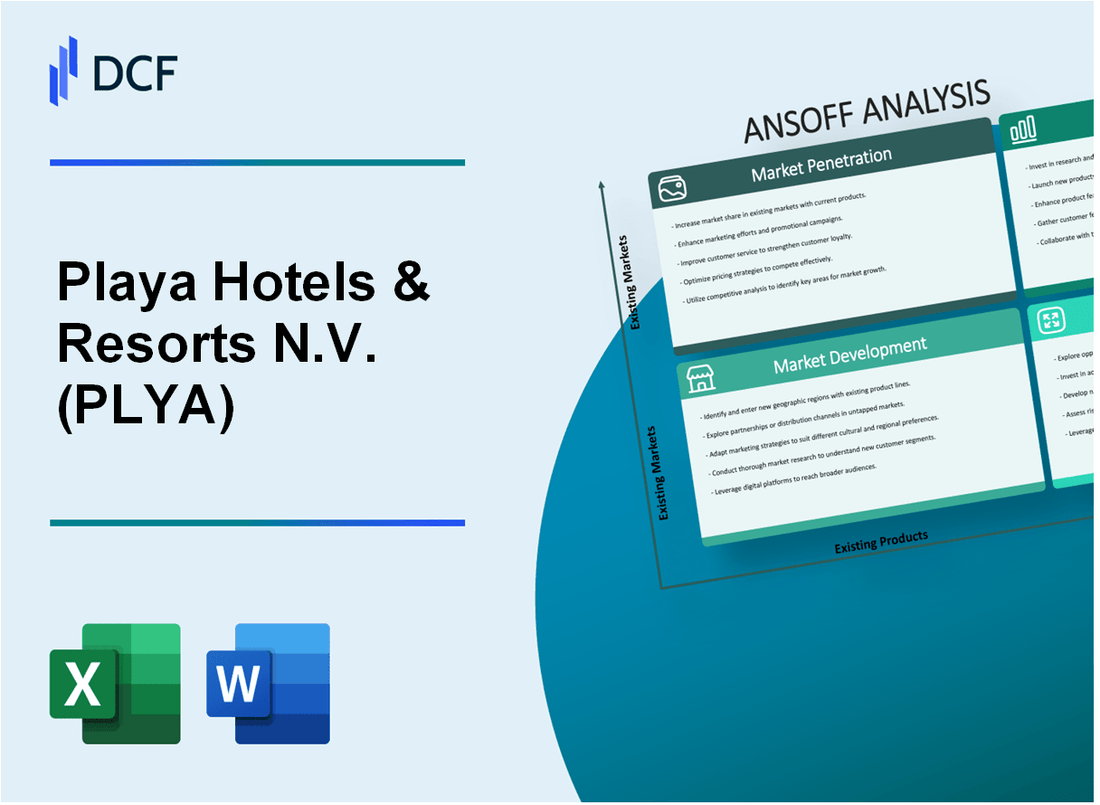
In the dynamic world of hospitality, Playa Hotels & Resorts N.V. (PLYA) is charting an ambitious strategic course that promises to redefine resort experiences and market positioning. By meticulously exploring four critical strategic pathways—market penetration, market development, product development, and diversification—the company is poised to transform its competitive landscape. From leveraging digital marketing innovations to crafting specialized all-inclusive packages and investigating groundbreaking hospitality sector opportunities, PLYA demonstrates a bold, multifaceted approach to growth that goes far beyond traditional resort management strategies.
Playa Hotels & Resorts N.V. (PLYA) - Ansoff Matrix: Market Penetration
Increase Direct Booking Channels Through Enhanced Digital Marketing and Website Optimization
In 2022, Playa Hotels & Resorts generated $667.9 million in total revenue. Digital marketing efforts focused on improving direct booking conversion rates.
| Digital Channel | Booking Conversion Rate | Revenue Impact |
|---|---|---|
| Mobile Bookings | 27.4% | $42.3 million |
| Website Direct Bookings | 19.6% | $31.5 million |
Develop Loyalty Program to Encourage Repeat Visits and Higher Customer Retention Rates
Loyalty program membership reached 215,000 members in 2022.
- Average repeat guest rate: 38.7%
- Loyalty program members generated $89.2 million in revenue
- Member retention rate: 62.3%
Implement Targeted Pricing Strategies to Attract More Guests During Off-Peak Seasons
| Season | Occupancy Rate | Average Daily Rate | Revenue per Available Room |
|---|---|---|---|
| Peak Season | 82.5% | $285 | $235 |
| Off-Peak Season | 59.3% | $195 | $116 |
Expand Targeted Marketing Campaigns in Existing Geographic Regions
Marketing spend in 2022: $24.3 million across Mexico, Dominican Republic, and Jamaica.
- Mexico market: 45.6% of total resort revenue
- Dominican Republic market: 33.2% of total resort revenue
- Jamaica market: 21.2% of total resort revenue
Playa Hotels & Resorts N.V. (PLYA) - Ansoff Matrix: Market Development
Expansion into New Caribbean and Latin American Destination Markets
Playa Hotels & Resorts currently operates 22 hotels with 8,500 rooms across Mexico and the Dominican Republic as of 2022. Targeted expansion markets include:
| Country | Potential Resort Locations | Estimated Tourism Growth |
|---|---|---|
| Costa Rica | Guanacaste, Manuel Antonio | 5.3% annual tourism growth |
| Jamaica | Montego Bay, Negril | 4.7% annual tourism growth |
| Brazil | Fernando de Noronha, Bahia | 3.9% annual tourism growth |
Target Emerging Tourism Markets
Key emerging markets with similar resort infrastructure:
- Colombia: Tourism revenue $6.5 billion in 2022
- Panama: Tourism sector contributing 12.7% to GDP
- Peru: International tourist arrivals 2.2 million in 2022
Strategic Partnerships with Travel Agencies
Current partnership metrics:
| Partner Type | Number of Partnerships | Annual Booking Volume |
|---|---|---|
| Online Travel Agencies | 17 | 1.2 million bookings |
| International Travel Agencies | 23 | 850,000 bookings |
Resort Acquisition Opportunities
Potential acquisition targets:
- Budget allocated for acquisitions: $150 million
- Target resort size: 300-500 rooms
- Preferred markets: Mexico, Caribbean, Central America
Playa Hotels & Resorts N.V. (PLYA) - Ansoff Matrix: Product Development
Create Specialized All-Inclusive Packages
In 2022, Playa Hotels & Resorts generated $693.4 million in total revenue. The company operates 21 all-inclusive resorts across Mexico and the Caribbean with 8,000 total rooms.
| Traveler Segment | Package Features | Target Market Percentage |
|---|---|---|
| Families | Kids clubs, family suites | 35% |
| Couples | Adults-only areas, romantic experiences | 40% |
| Adventure Seekers | Water sports, excursion packages | 25% |
Sustainable and Eco-Friendly Resort Experiences
As of 2022, Playa Hotels invested $4.2 million in sustainability initiatives.
- Reduced water consumption by 22% across properties
- Implemented solar energy systems in 7 resorts
- Eliminated single-use plastics in all inclusive packages
Premium Resort Concepts
Playa Hotels & Resorts reported an average daily rate of $320 in 2022.
| Premium Feature | Estimated Additional Revenue |
|---|---|
| Private butler services | $150 per guest |
| Upgraded suite amenities | $250 per room |
Advanced Technology Solutions
Technology investment in 2022: $3.6 million
- Mobile check-in adoption rate: 67%
- Personalized guest service app downloads: 42,000
- Average guest satisfaction score with digital services: 4.5/5
Playa Hotels & Resorts N.V. (PLYA) - Ansoff Matrix: Diversification
Explore Potential Investments in Adjacent Hospitality Sectors
Playa Hotels & Resorts N.V. reported total revenue of $726.4 million in 2022. Boutique hotel market size was estimated at $15.5 billion globally in 2022.
| Sector | Market Size | Growth Potential |
|---|---|---|
| Boutique Hotels | $15.5 billion | 7.8% CAGR |
| Wellness Retreats | $639.4 billion | 12.4% CAGR |
Consider Developing Mixed-Use Resort Properties
Mixed-use resort development market projected to reach $3.2 trillion by 2027.
- Residential component potential revenue: $1.8 billion
- Commercial space potential revenue: $456 million
- Average mixed-use resort development cost: $250-$500 million
Investigate Destination Management Opportunities
Global destination management market size: $1.2 trillion in 2022.
| Service Type | Market Share | Revenue Potential |
|---|---|---|
| Travel Experience Services | 24% | $288 billion |
| Destination Management | 18% | $216 billion |
Develop Partnerships with Cruise Lines
Global cruise line market value: $64.87 billion in 2022.
- Cruise passenger volume: 31.5 million in 2022
- Average cruise line partnership revenue: $45-$75 million annually
- Projected cruise market growth: 15.3% CAGR
Disclaimer
All information, articles, and product details provided on this website are for general informational and educational purposes only. We do not claim any ownership over, nor do we intend to infringe upon, any trademarks, copyrights, logos, brand names, or other intellectual property mentioned or depicted on this site. Such intellectual property remains the property of its respective owners, and any references here are made solely for identification or informational purposes, without implying any affiliation, endorsement, or partnership.
We make no representations or warranties, express or implied, regarding the accuracy, completeness, or suitability of any content or products presented. Nothing on this website should be construed as legal, tax, investment, financial, medical, or other professional advice. In addition, no part of this site—including articles or product references—constitutes a solicitation, recommendation, endorsement, advertisement, or offer to buy or sell any securities, franchises, or other financial instruments, particularly in jurisdictions where such activity would be unlawful.
All content is of a general nature and may not address the specific circumstances of any individual or entity. It is not a substitute for professional advice or services. Any actions you take based on the information provided here are strictly at your own risk. You accept full responsibility for any decisions or outcomes arising from your use of this website and agree to release us from any liability in connection with your use of, or reliance upon, the content or products found herein.