
|
Power Grid Corporation of India Limited (POWERGRID.NS) DCF Valuation |
Fully Editable: Tailor To Your Needs In Excel Or Sheets
Professional Design: Trusted, Industry-Standard Templates
Investor-Approved Valuation Models
MAC/PC Compatible, Fully Unlocked
No Expertise Is Needed; Easy To Follow
Power Grid Corporation of India Limited (POWERGRID.NS) Bundle
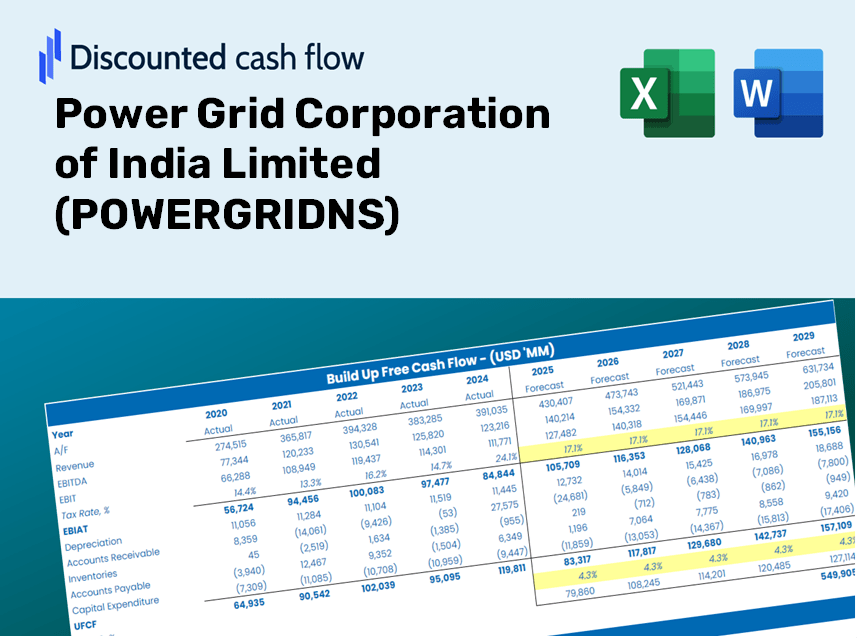
Discover the true potential of Power Grid Corporation of India Limited (POWERGRIDNS) with our advanced DCF Calculator! Adjust key inputs, explore various scenarios, and assess how different factors influence the valuation of Power Grid Corporation of India Limited (POWERGRIDNS) – all conveniently provided in one Excel template.
What You Will Receive
- Genuine POWERGRID Data: Preloaded financial metrics – covering everything from revenue to EBIT – based on actual and projected statistics.
- Comprehensive Customization: Modify all essential parameters (yellow cells) such as WACC, growth rate, and tax percentages.
- Instant Valuation Adjustments: Automatic recalculations to assess the effects of changes on POWERGRID's fair value.
- Flexible Excel Template: Designed for easy modifications, scenario analysis, and detailed forecasting.
- Efficiency and Precision: Eliminate the need to build models from the ground up while ensuring accuracy and adaptability.
Key Features
- Comprehensive Data: POWERGRIDNS's historical financial records and pre-filled projections.
- Customizable Parameters: Modify WACC, tax rates, revenue growth, and EBITDA margins as needed.
- Real-Time Calculations: Observe POWERGRIDNS's intrinsic value update instantly.
- Insightful Visual Displays: Dashboard graphs showcase valuation outcomes and essential metrics.
- Designed for Precision: A robust tool for analysts, investors, and finance professionals.
How It Functions
- Download: Obtain the pre-configured Excel file featuring Power Grid Corporation of India Limited’s (POWERGRIDNS) financial data.
- Customize: Modify forecasts, including revenue growth, EBITDA %, and WACC as needed.
- Update Automatically: The intrinsic value and NPV calculations refresh in real-time.
- Test Scenarios: Formulate various projections and compare the results instantly.
- Make Decisions: Leverage the valuation outcomes to inform your investment strategy.
Why Choose This Calculator for Power Grid Corporation of India Limited (POWERGRIDNS)?
- User-Friendly Interface: Perfectly suited for both novices and seasoned users.
- Customizable Inputs: Effortlessly adjust parameters to tailor your analysis.
- Real-Time Updates: Instantly see how changes impact the valuation of Power Grid Corporation.
- Pre-Configured Data: Comes with Power Grid's actual financial metrics for swift evaluations.
- Endorsed by Experts: A preferred choice among investors and analysts for making strategic decisions.
Who Can Benefit from This Product?
- Individual Investors: Gain insights to make informed choices about trading Power Grid Corporation of India Limited (POWERGRIDNS) shares.
- Financial Analysts: Enhance valuation methodologies with easily accessible financial models tailored for POWERGRIDNS.
- Consultants: Provide clients with accurate and timely valuation assessments regarding Power Grid Corporation of India Limited (POWERGRIDNS).
- Business Owners: Learn from the valuation practices of major companies like Power Grid Corporation of India Limited (POWERGRIDNS) to inform your strategic decisions.
- Finance Students: Explore valuation principles using real-world examples involving Power Grid Corporation of India Limited (POWERGRIDNS).
Contents of the Template
- Preloaded POWERGRID Data: Historical and projected financial metrics, including revenue, EBIT, and capital expenditures.
- DCF and WACC Models: Advanced spreadsheets for calculating intrinsic value and the Weighted Average Cost of Capital.
- Editable Inputs: Cells highlighted in yellow for modifying revenue growth projections, tax rates, and discount rates.
- Financial Statements: Detailed annual and quarterly financials for thorough analysis.
- Key Ratios: Metrics for profitability, leverage, and efficiency to assess performance.
- Dashboard and Charts: Visual representations of valuation results and underlying assumptions.
Disclaimer
All information, articles, and product details provided on this website are for general informational and educational purposes only. We do not claim any ownership over, nor do we intend to infringe upon, any trademarks, copyrights, logos, brand names, or other intellectual property mentioned or depicted on this site. Such intellectual property remains the property of its respective owners, and any references here are made solely for identification or informational purposes, without implying any affiliation, endorsement, or partnership.
We make no representations or warranties, express or implied, regarding the accuracy, completeness, or suitability of any content or products presented. Nothing on this website should be construed as legal, tax, investment, financial, medical, or other professional advice. In addition, no part of this site—including articles or product references—constitutes a solicitation, recommendation, endorsement, advertisement, or offer to buy or sell any securities, franchises, or other financial instruments, particularly in jurisdictions where such activity would be unlawful.
All content is of a general nature and may not address the specific circumstances of any individual or entity. It is not a substitute for professional advice or services. Any actions you take based on the information provided here are strictly at your own risk. You accept full responsibility for any decisions or outcomes arising from your use of this website and agree to release us from any liability in connection with your use of, or reliance upon, the content or products found herein.