
|
Hitachi Energy India Limited (POWERINDIA.NS) DCF Valuation |
Fully Editable: Tailor To Your Needs In Excel Or Sheets
Professional Design: Trusted, Industry-Standard Templates
Investor-Approved Valuation Models
MAC/PC Compatible, Fully Unlocked
No Expertise Is Needed; Easy To Follow
Hitachi Energy India Limited (POWERINDIA.NS) Bundle
Simplify Hitachi Energy India Limited valuation with this customizable DCF Calculator! Featuring real Hitachi Energy India Limited financials and adjustable forecast inputs, you can test scenarios and uncover Hitachi Energy India Limited's fair value in minutes.
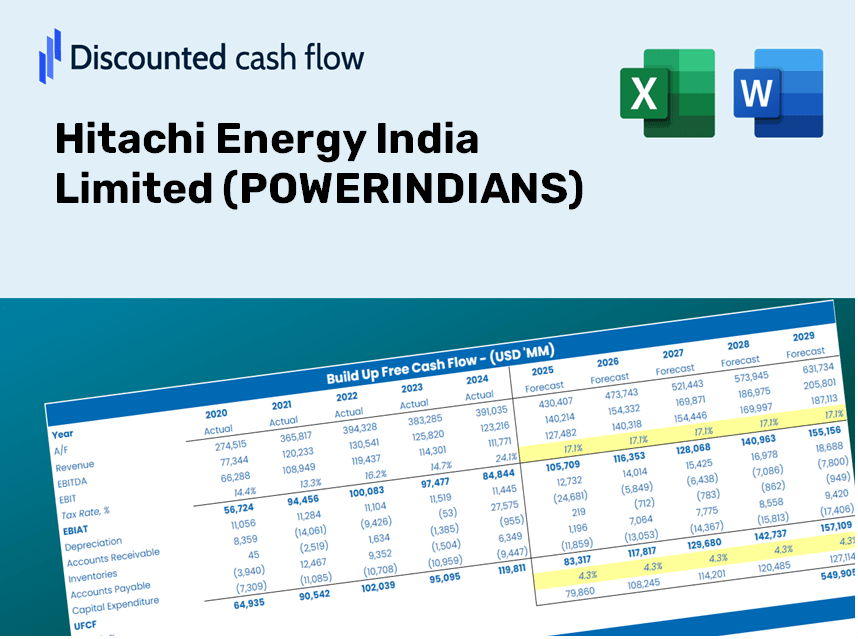
Discounted Cash Flow (DCF) - (USD MM)
| Year | AY1 2021 |
AY2 2022 |
AY3 2023 |
AY4 2024 |
AY5 2025 |
FY1 2026 |
FY2 2027 |
FY3 2028 |
FY4 2029 |
FY5 2030 |
|---|---|---|---|---|---|---|---|---|---|---|
| Revenue | 34,204.4 | 38,684.3 | 44,685.1 | 52,374.9 | 63,849.3 | 74,660.1 | 87,301.3 | 102,082.8 | 119,367.2 | 139,578.1 |
| Revenue Growth, % | 0 | 13.1 | 15.51 | 17.21 | 21.91 | 16.93 | 16.93 | 16.93 | 16.93 | 16.93 |
| EBITDA | 2,403.9 | 2,254.4 | 2,468.3 | 3,328.7 | 5,795.2 | 5,048.7 | 5,903.6 | 6,903.1 | 8,071.9 | 9,438.7 |
| EBITDA, % | 7.03 | 5.83 | 5.52 | 6.36 | 9.08 | 6.76 | 6.76 | 6.76 | 6.76 | 6.76 |
| Depreciation | 660.2 | 624.0 | 635.0 | 735.3 | 744.1 | 1,124.9 | 1,315.4 | 1,538.1 | 1,798.5 | 2,103.0 |
| Depreciation, % | 1.93 | 1.61 | 1.42 | 1.4 | 1.17 | 1.51 | 1.51 | 1.51 | 1.51 | 1.51 |
| EBIT | 1,743.7 | 1,630.4 | 1,833.3 | 2,593.4 | 5,051.1 | 3,923.8 | 4,588.2 | 5,365.0 | 6,273.4 | 7,335.6 |
| EBIT, % | 5.1 | 4.21 | 4.1 | 4.95 | 7.91 | 5.26 | 5.26 | 5.26 | 5.26 | 5.26 |
| Total Cash | 3,189.5 | 859.4 | 1,631.9 | 1,282.0 | 38,067.7 | 11,537.6 | 13,491.1 | 15,775.3 | 18,446.4 | 21,569.6 |
| Total Cash, percent | .0 | .0 | .0 | .0 | .0 | .0 | .0 | .0 | .0 | .0 |
| Account Receivables | 17,111.0 | .0 | .0 | 24,027.5 | 21,095.8 | 19,253.6 | 22,513.5 | 26,325.5 | 30,782.8 | 35,994.9 |
| Account Receivables, % | 50.03 | 0 | 0 | 45.88 | 33.04 | 25.79 | 25.79 | 25.79 | 25.79 | 25.79 |
| Inventories | 4,950.8 | 7,072.5 | 8,179.0 | 8,879.4 | 9,257.1 | 12,320.7 | 14,406.9 | 16,846.2 | 19,698.5 | 23,033.8 |
| Inventories, % | 14.47 | 18.28 | 18.3 | 16.95 | 14.5 | 16.5 | 16.5 | 16.5 | 16.5 | 16.5 |
| Accounts Payable | 15,779.8 | 16,190.0 | 15,146.2 | 18,097.2 | 20,418.8 | 28,134.0 | 32,897.5 | 38,467.6 | 44,980.8 | 52,596.8 |
| Accounts Payable, % | 46.13 | 41.85 | 33.9 | 34.55 | 31.98 | 37.68 | 37.68 | 37.68 | 37.68 | 37.68 |
| Capital Expenditure | -914.7 | -1,680.0 | -120.1 | -893.6 | -1,281.3 | -1,642.3 | -1,920.4 | -2,245.6 | -2,625.8 | -3,070.4 |
| Capital Expenditure, % | -2.67 | -4.34 | -0.26877 | -1.71 | -2.01 | -2.2 | -2.2 | -2.2 | -2.2 | -2.2 |
| Tax Rate, % | 25.64 | 25.64 | 25.64 | 25.64 | 25.64 | 25.64 | 25.64 | 25.64 | 25.64 | 25.64 |
| EBITAT | 1,276.9 | 1,199.6 | 1,315.9 | 1,915.9 | 3,755.9 | 2,878.6 | 3,366.0 | 3,936.0 | 4,602.4 | 5,381.7 |
| Depreciation | ||||||||||
| Changes in Account Receivables | ||||||||||
| Changes in Inventories | ||||||||||
| Changes in Accounts Payable | ||||||||||
| Capital Expenditure | ||||||||||
| UFCF | -5,259.6 | 15,543.1 | -319.5 | -20,019.3 | 8,094.3 | 8,854.9 | 2,178.5 | 2,547.4 | 2,978.7 | 3,483.0 |
| WACC, % | 5.39 | 5.39 | 5.38 | 5.39 | 5.39 | 5.39 | 5.39 | 5.39 | 5.39 | 5.39 |
| PV UFCF | ||||||||||
| SUM PV UFCF | 17,634.8 | |||||||||
| Long Term Growth Rate, % | 4.00 | |||||||||
| Free cash flow (T + 1) | 3,622 | |||||||||
| Terminal Value | 261,445 | |||||||||
| Present Terminal Value | 201,129 | |||||||||
| Enterprise Value | 218,764 | |||||||||
| Net Debt | -37,183 | |||||||||
| Equity Value | 255,947 | |||||||||
| Diluted Shares Outstanding, MM | 42 | |||||||||
| Equity Value Per Share | 6,022.86 |
What You Will Receive
- Authentic POWERINDIANS Financial Data: Pre-loaded with Hitachi Energy India Limited’s historical and forecasted data for accurate analysis.
- Completely Customizable Template: Easily adjust key parameters such as revenue growth, WACC, and EBITDA %.
- Instantaneous Calculations: Watch as the intrinsic value of Hitachi Energy India Limited updates in real-time with your modifications.
- Professional Valuation Tool: Tailored for investors, analysts, and consultants aiming for precise DCF outcomes.
- User-Friendly Interface: Straightforward layout and clear guidelines suitable for users of all experience levels.
Key Features
- Comprehensive Historical Data: Access Hitachi Energy India Limited’s (POWERINDIANS) past financial statements and prepared forecasts.
- Customizable Inputs: Adjust parameters such as WACC, tax rates, revenue growth, and EBITDA margins to suit your analysis.
- Real-Time Results: Instantly view the recalculated intrinsic value of Hitachi Energy India Limited (POWERINDIANS).
- Intuitive Visualizations: Interactive dashboard graphs present valuation outcomes and essential metrics clearly.
- Designed for Precision: A robust tool tailored for analysts, investors, and finance professionals.
How It Operates
- 1. Access the Template: Download and open the Excel file featuring Hitachi Energy India Limited's (POWERINDIANS) preloaded data.
- 2. Modify Assumptions: Update key parameters such as growth rates, WACC, and capital expenditures.
- 3. See Results Immediately: The DCF model swiftly computes intrinsic value and NPV.
- 4. Evaluate Scenarios: Analyze various forecasts to explore different valuation possibilities.
- 5. Utilize with Assurance: Provide professional valuation insights to bolster your decision-making process.
Why Choose This Calculator for Hitachi Energy India Limited (POWERINDIANS)?
- User-Friendly Interface: Perfectly tailored for both novices and seasoned professionals.
- Customizable Inputs: Adjust parameters effortlessly to suit your financial analysis.
- Real-Time Feedback: Observe immediate updates to Hitachi Energy's valuation as you modify the data.
- Pre-Loaded Data: Comes equipped with Hitachi Energy's actual financial figures for fast and efficient assessments.
- Preferred by Experts: Widely utilized by investors and analysts for sound decision-making.
Who Can Benefit from This Product?
- Finance Students: Master valuation methods and practice with authentic data.
- Researchers: Use established models in your academic projects or studies.
- Investors: Evaluate your assumptions and assess valuation scenarios for Hitachi Energy India Limited (POWERINDIANS).
- Analysts: Enhance your efficiency with a customizable, ready-to-use DCF model.
- Entrepreneurs: Discover how major public entities like Hitachi Energy India Limited are assessed.
Overview of the Template's Features
- Preloaded POWERINDIANS Data: Historical and forecasted financial metrics, including revenue, EBIT, and capital expenditures.
- DCF and WACC Models: Advanced spreadsheets for determining intrinsic value and the Weighted Average Cost of Capital.
- Editable Inputs: Cells highlighted in yellow for modifying revenue growth, tax rates, and discount rates.
- Financial Statements: Detailed annual and quarterly financial reports for thorough analysis.
- Key Ratios: Metrics including profitability, leverage, and efficiency ratios to assess performance.
- Dashboard and Charts: Visual representations of valuation results and underlying assumptions.
Disclaimer
All information, articles, and product details provided on this website are for general informational and educational purposes only. We do not claim any ownership over, nor do we intend to infringe upon, any trademarks, copyrights, logos, brand names, or other intellectual property mentioned or depicted on this site. Such intellectual property remains the property of its respective owners, and any references here are made solely for identification or informational purposes, without implying any affiliation, endorsement, or partnership.
We make no representations or warranties, express or implied, regarding the accuracy, completeness, or suitability of any content or products presented. Nothing on this website should be construed as legal, tax, investment, financial, medical, or other professional advice. In addition, no part of this site—including articles or product references—constitutes a solicitation, recommendation, endorsement, advertisement, or offer to buy or sell any securities, franchises, or other financial instruments, particularly in jurisdictions where such activity would be unlawful.
All content is of a general nature and may not address the specific circumstances of any individual or entity. It is not a substitute for professional advice or services. Any actions you take based on the information provided here are strictly at your own risk. You accept full responsibility for any decisions or outcomes arising from your use of this website and agree to release us from any liability in connection with your use of, or reliance upon, the content or products found herein.