
|
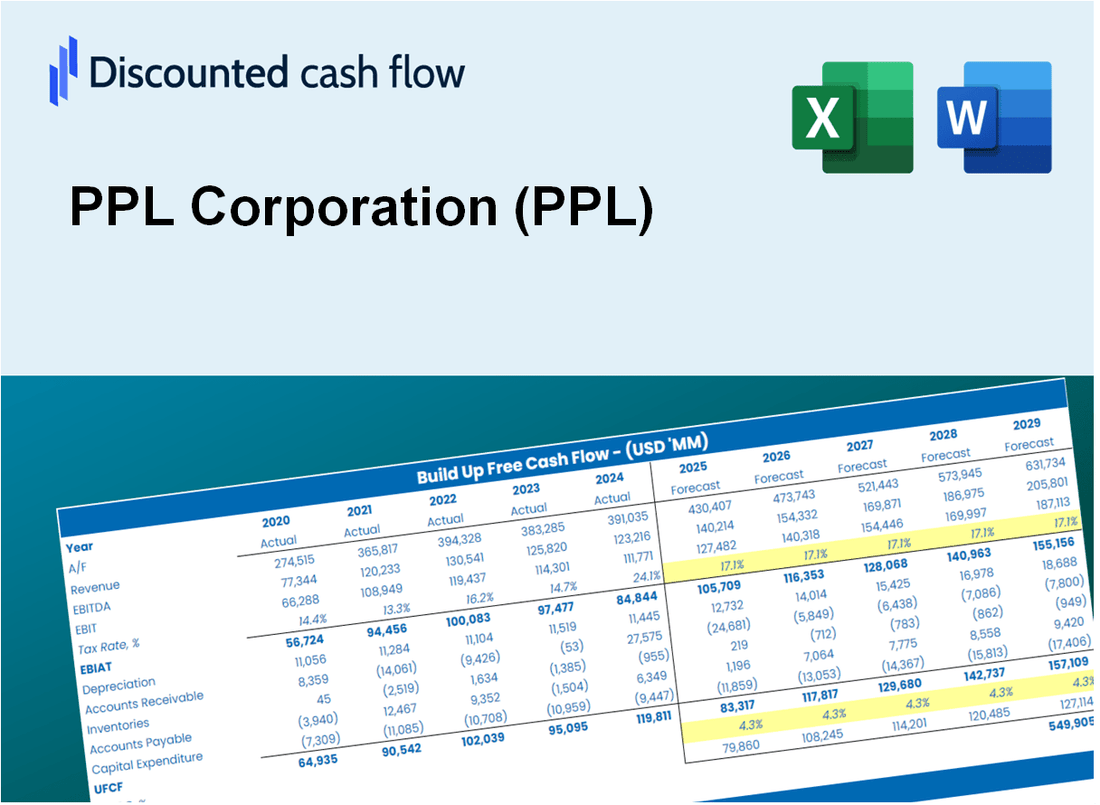
PPL Corporation (PPL) DCF Valuation |
Fully Editable: Tailor To Your Needs In Excel Or Sheets
Professional Design: Trusted, Industry-Standard Templates
Investor-Approved Valuation Models
MAC/PC Compatible, Fully Unlocked
No Expertise Is Needed; Easy To Follow
PPL Corporation (PPL) Bundle
Streamline your analysis and improve precision with our PPL Corporation (PPL) DCF Calculator! Utilizing real data from PPL and customizable assumptions, this tool enables you to forecast, analyze, and evaluate PPL Corporation like a seasoned investor.
Discounted Cash Flow (DCF) - (USD MM)
| Year | AY1 2021 |
AY2 2022 |
AY3 2023 |
AY4 2024 |
AY5 2025 |
FY1 2026 |
FY2 2027 |
FY3 2028 |
FY4 2029 |
FY5 2030 |
|---|---|---|---|---|---|---|---|---|---|---|
| Revenue | 5,783.0 | 7,902.0 | 8,312.0 | 8,462.0 | 9,042.0 | 9,379.2 | 9,569.6 | 9,675.3 | 9,733.4 | 9,765.3 |
| Revenue Growth, % | 0 | 36.64 | 5.19 | 1.8 | 6.85 | 3.73 | 2.03 | 1.1 | 0.60098 | 0.32703 |
| EBITDA | 2,560.0 | 2,661.0 | 2,925.0 | 3,211.0 | 3,684.0 | 3,598.3 | 3,671.3 | 3,711.9 | 3,734.2 | 3,746.4 |
| EBITDA, % | 44.27 | 33.68 | 35.19 | 37.95 | 40.74 | 38.36 | 38.36 | 38.36 | 38.36 | 38.36 |
| Depreciation | 1,121.0 | 1,233.0 | 1,335.0 | 1,357.0 | 1,404.0 | 1,549.7 | 1,581.1 | 1,598.6 | 1,608.2 | 1,613.5 |
| Depreciation, % | 19.38 | 15.6 | 16.06 | 16.04 | 15.53 | 16.52 | 16.52 | 16.52 | 16.52 | 16.52 |
| EBIT | 1,439.0 | 1,428.0 | 1,590.0 | 1,854.0 | 2,280.0 | 2,404.8 | 2,494.0 | 2,562.1 | 2,618.0 | 2,667.0 |
| EBIT, % | 24.88 | 18.07 | 19.13 | 21.91 | 25.22 | 25.64 | 26.06 | 26.48 | 26.9 | 27.31 |
| Total Cash | 3,571.0 | 356.0 | 331.0 | 306.0 | 1,086.0 | 1,610.7 | 1,643.4 | 1,661.5 | 1,671.5 | 1,677.0 |
| Total Cash, percent | .0 | .0 | .0 | .0 | .0 | .0 | .0 | .0 | .0 | .0 |
| Account Receivables | 890.0 | 1,448.0 | 1,649.0 | 1,446.0 | 1,783.0 | 1,917.0 | 2,024.1 | 2,114.8 | 2,195.7 | 2,270.7 |
| Account Receivables, % | 15.39 | 18.32 | 19.84 | 17.09 | 19.72 | 20.44 | 21.15 | 21.86 | 22.56 | 23.25 |
| Inventories | 322.0 | 443.0 | 505.0 | 511.0 | 551.0 | 585.4 | 611.4 | 632.4 | 650.6 | 667.0 |
| Inventories, % | 5.57 | 5.61 | 6.08 | 6.04 | 6.09 | 6.24 | 6.39 | 6.54 | 6.68 | 6.83 |
| Accounts Payable | 679.0 | 1,201.0 | 1,104.0 | 1,196.0 | 1,559.0 | 1,706.8 | 1,831.9 | 1,942.6 | 2,044.1 | 2,139.9 |
| Accounts Payable, % | 11.74 | 15.2 | 13.28 | 14.13 | 17.24 | 18.2 | 19.14 | 20.08 | 21 | 21.91 |
| Capital Expenditure | -1,973.0 | -2,155.0 | -2,390.0 | -2,805.0 | -4,030.0 | -3,148.8 | -3,212.7 | -3,248.2 | -3,267.7 | -3,278.4 |
| Capital Expenditure, % | -34.12 | -27.27 | -28.75 | -33.15 | -44.57 | -33.57 | -33.57 | -33.57 | -33.57 | -33.57 |
| Tax Rate, % | 19.77 | 19.77 | 19.77 | 19.77 | 19.77 | 19.77 | 19.77 | 19.77 | 19.77 | 19.77 |
| EBITAT | -4,087.8 | 1,179.9 | 1,273.4 | 1,475.2 | 1,829.3 | 1,551.1 | 1,608.7 | 1,652.6 | 1,688.7 | 1,720.3 |
| Depreciation | ||||||||||
| Changes in Account Receivables | ||||||||||
| Changes in Inventories | ||||||||||
| Changes in Accounts Payable | ||||||||||
| Capital Expenditure | ||||||||||
| UFCF | -5,472.8 | 100.9 | -141.6 | 316.2 | -810.7 | -68.5 | -31.0 | 1.9 | 31.7 | 59.8 |
| WACC, % | 4.14 | 5.54 | 5.5 | 5.49 | 5.5 | 5.23 | 5.23 | 5.23 | 5.23 | 5.23 |
| PV UFCF | ||||||||||
| SUM PV UFCF | -19.3 | |||||||||
| Long Term Growth Rate, % | 2.00 | |||||||||
| Free cash flow (T + 1) | 61 | |||||||||
| Terminal Value | 1,886 | |||||||||
| Present Terminal Value | 1,462 | |||||||||
| Enterprise Value | 1,442 | |||||||||
| Net Debt | 18,264 | |||||||||
| Equity Value | -16,822 | |||||||||
| Diluted Shares Outstanding, MM | 745 | |||||||||
| Equity Value Per Share | -22.58 |
What You Will Get
- Real PPL Data: Preloaded financials – from revenue to EBIT – based on actual and projected figures for PPL Corporation (PPL).
- Full Customization: Adjust all critical parameters (yellow cells) such as WACC, growth %, and tax rates specific to PPL Corporation (PPL).
- Instant Valuation Updates: Automatic recalculations to analyze the impact of changes on PPL Corporation (PPL)’s fair value.
- Versatile Excel Template: Designed for quick edits, scenario testing, and detailed projections for PPL Corporation (PPL).
- Time-Saving and Accurate: Avoid building models from scratch while ensuring precision and flexibility for PPL Corporation (PPL).
Key Features
- Customizable Financial Inputs: Adjust essential parameters such as revenue growth, EBITDA %, and capital expenditures for PPL Corporation (PPL).
- Instant DCF Valuation: Quickly calculates intrinsic value, NPV, and other financial metrics for PPL Corporation (PPL).
- High-Precision Accuracy: Utilizes PPL Corporation (PPL)'s actual financial data for credible valuation results.
- Effortless Scenario Analysis: Easily evaluate various assumptions and compare results for PPL Corporation (PPL).
- Efficiency Booster: Streamline the valuation process without the need for complex model construction for PPL Corporation (PPL).
How It Works
- Step 1: Download the prebuilt Excel template with PPL Corporation’s (PPL) data included.
- Step 2: Explore the pre-filled sheets and familiarize yourself with the key metrics.
- Step 3: Update forecasts and assumptions in the editable yellow cells (WACC, growth, margins).
- Step 4: Instantly view recalculated results, including PPL Corporation’s (PPL) intrinsic value.
- Step 5: Make informed investment decisions or generate reports using the outputs.
Why Choose This Calculator for PPL Corporation (PPL)?
- Accuracy: Utilizes real PPL financials to ensure precise data.
- Flexibility: Tailored for users to easily test and adjust inputs as needed.
- Time-Saving: Avoid the complexity of constructing a DCF model from the ground up.
- Professional-Grade: Crafted with the precision and usability expected at the CFO level.
- User-Friendly: Intuitive design makes it accessible for users without advanced financial modeling skills.
Who Should Use This Product?
- Professional Investors: Develop comprehensive and accurate valuation models for investment analysis in PPL Corporation (PPL).
- Corporate Finance Teams: Evaluate valuation scenarios to inform strategic decisions within their organizations.
- Consultants and Advisors: Offer clients precise valuation insights for PPL Corporation (PPL) stock.
- Students and Educators: Utilize real-world data to enhance learning and practice in financial modeling.
- Energy Sector Enthusiasts: Gain insights into how utility companies like PPL Corporation (PPL) are valued in the market.
What the Template Contains
- Operating and Balance Sheet Data: Pre-filled PPL Corporation (PPL) historical data and forecasts, including revenue, EBITDA, EBIT, and capital expenditures.
- WACC Calculation: A dedicated sheet for Weighted Average Cost of Capital (WACC), including parameters like Beta, risk-free rate, and share price.
- DCF Valuation (Unlevered and Levered): Editable Discounted Cash Flow models showing intrinsic value with detailed calculations.
- Financial Statements: Pre-loaded financial statements (annual and quarterly) to support analysis.
- Key Ratios: Includes profitability, leverage, and efficiency ratios for PPL Corporation (PPL).
- Dashboard and Charts: Visual summary of valuation outputs and assumptions to analyze results easily.
Disclaimer
All information, articles, and product details provided on this website are for general informational and educational purposes only. We do not claim any ownership over, nor do we intend to infringe upon, any trademarks, copyrights, logos, brand names, or other intellectual property mentioned or depicted on this site. Such intellectual property remains the property of its respective owners, and any references here are made solely for identification or informational purposes, without implying any affiliation, endorsement, or partnership.
We make no representations or warranties, express or implied, regarding the accuracy, completeness, or suitability of any content or products presented. Nothing on this website should be construed as legal, tax, investment, financial, medical, or other professional advice. In addition, no part of this site—including articles or product references—constitutes a solicitation, recommendation, endorsement, advertisement, or offer to buy or sell any securities, franchises, or other financial instruments, particularly in jurisdictions where such activity would be unlawful.
All content is of a general nature and may not address the specific circumstances of any individual or entity. It is not a substitute for professional advice or services. Any actions you take based on the information provided here are strictly at your own risk. You accept full responsibility for any decisions or outcomes arising from your use of this website and agree to release us from any liability in connection with your use of, or reliance upon, the content or products found herein.