
|
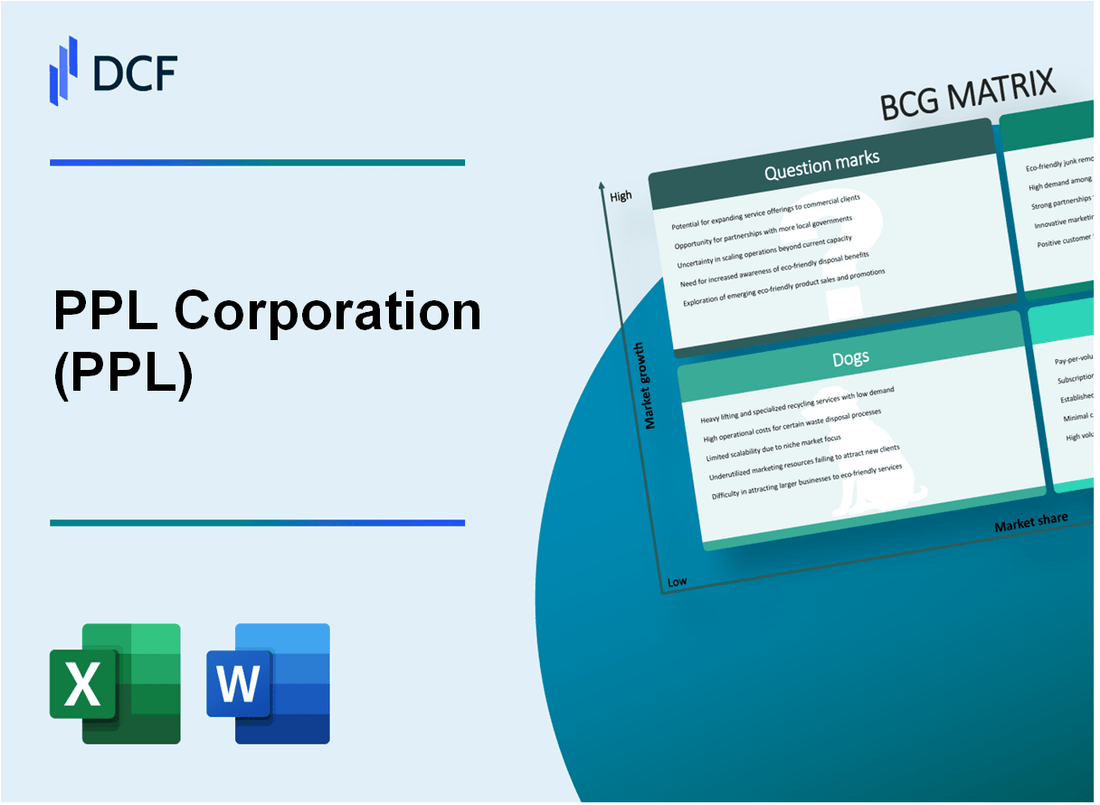
PPL Corporation (PPL): BCG Matrix [Apr-2026 Updated] |
Fully Editable: Tailor To Your Needs In Excel Or Sheets
Professional Design: Trusted, Industry-Standard Templates
Investor-Approved Valuation Models
MAC/PC Compatible, Fully Unlocked
No Expertise Is Needed; Easy To Follow
PPL Corporation (PPL) Bundle
You're looking to map out where PPL Corporation's capital is best deployed right now, so I've run their portfolio through the classic four-quadrant BCG Matrix. Honestly, the picture is clear: we have massive growth potential in transmission, driven by nearly 11 GW of advanced requests and a $20 billion regulated capital plan through 2028, which sits alongside the reliable Cash Cows in Kentucky that promise 6% to 8% dividend growth. But we also need to address the Dogs, like the coal assets set for retirement by 2050, and figure out what to do with Question Marks like the small Rhode Island segment showing just $0.01 EPS in Q2 2025. Dive in below to see the full, unvarnished breakdown of PPL Corporation's Stars, Cash Cows, Dogs, and Question Marks to understand where the next big investment decision lies.
Background of PPL Corporation (PPL)
You're looking at PPL Corporation (PPL), a major U.S. energy company headquartered in Allentown, Pennsylvania. Honestly, PPL's core business is pretty straightforward: they provide electricity and natural gas to over 3.6 million customers across the country. The company's operations are concentrated in regulated utility jurisdictions, which gives them a certain level of predictable revenue, though you always have to watch regulatory lag.
PPL Corporation's structure is built around three principal regulated utility segments. You've got the Kentucky Regulated segment, which includes Louisville Gas and Electric Company and Kentucky Utilities Company, handling both electricity and natural gas delivery. Then there's the Pennsylvania Regulated segment, which is PPL Electric Utilities, focused on electricity delivery. Finally, they have the Rhode Island Regulated segment, which came from the acquisition of Rhode Island Energy back in May 2022.
The company is heavily focused on its "utility of the future" strategy right now. This means they're pouring capital into modernizing and hardening their electric and gas networks to handle severe weather better and support things like data centers. PPL has increased its planned infrastructure investments to $20 billion over the period spanning 2025 through 2028, up from the prior plan of $14.3 billion. For 2025 specifically, they are targeting $4.3 billion in these infrastructure investments alone.
These significant capital expenditures are designed to drive growth in their regulated asset base. PPL projects an average annual rate base growth of 9.8% through 2028 as a result of this investment push. Financially, for the full year 2025, PPL Corporation narrowed its ongoing earnings forecast range to $1.78 to $1.84 per share, landing on a midpoint expectation of $1.81 per share. They are sticking to a long-term goal of 6% to 8% annual EPS and dividend growth through at least 2028.
Looking at the most recent numbers available-the third quarter of 2025-PPL reported GAAP earnings per share of $0.43, a nice jump from $0.29 in the third quarter of 2024. Their ongoing earnings for that quarter hit $0.48 per share. Revenue for the quarter ending September 30, 2025, was $2.24B, showing 8.37% growth for that period, bringing the trailing twelve months revenue up to $8.98B. The company maintains a strong financial footing, holding top-tier credit ratings like A- from S&P.
PPL Corporation (PPL) - BCG Matrix: Stars
The business units considered Stars for PPL Corporation are those operating in rapidly expanding markets where the company holds a leading market share, primarily driven by massive data center development. The Pennsylvania Data Center Transmission segment exemplifies this, currently showing nearly 11 GW of advanced-stage interconnection requests, which is part of a larger, generational growth opportunity with a pipeline reaching 20.5 GW in the Pennsylvania service territory alone. This high-growth, high-share positioning requires substantial investment to maintain leadership, which is why these units consume significant cash flow.
The strategic investment underpinning these Stars is clearly defined by PPL Corporation's financial commitments for the near term. You can see the core financial metrics driving this growth below:
| Metric | Value/Range | Period/Context |
| Regulated Capital Plan Amount | $20 billion | 2025-2028 |
| Average Annual Rate Base Growth Target | 9.8% | Through 2028 |
| Targeted Annual EPS Growth | 6% to 8% | Through at least 2028 |
| 2025 Infrastructure Investment Target | $4.3 billion | 2025 only |
This aggressive capital deployment is designed to secure the company's leadership in the high-growth data center space and ensure future revenue stability. The expected rate base expansion directly correlates with the success of these growth areas. You're looking at a utility actively investing to capture future demand, not just maintain current service levels.
The investment is channeled into critical areas to future-proof the network and support this demand surge. These efforts include:
- Grid modernization initiatives.
- Smart-grid technology deployment.
- Transmission system upgrades to handle concentrated loads.
PPL Corporation expects to deliver earnings per share growth in the top half of its 6% to 8% annual target through at least 2028, which is predicated on successfully executing this capital plan and converting these high-growth opportunities into sustained rate base returns. The company's 2025 ongoing earnings forecast midpoint is set at $1.81 per share, which serves as the base for this projected growth.
PPL Corporation (PPL) - BCG Matrix: Cash Cows
You're looking at the bedrock of PPL Corporation's stability, the units that generate more cash than they consume, funding the rest of the enterprise. For PPL, this is squarely in the regulated utility space.
The Kentucky Regulated segment, which includes Louisville Gas & Electric Company (LG&E) and Kentucky Utilities Company (KU), is the prime example of a Cash Cow. These operations provide stable, predictable utility earnings because they operate under regulatory oversight, which guarantees a return on invested capital. For instance, looking at the first nine months of 2025, the segment generated $1.04 billion in Earnings from Ongoing Operations, up from $994 million for the same period in 2024. This consistency is what makes it a Cash Cow; it's mature, has a high market share by definition of its service territory, and reliably converts revenue into cash flow.
These core regulated electricity and gas distribution operations are characterized by a guaranteed high market share within their defined jurisdictions. The regulatory compact allows PPL Corporation to focus on infrastructure support rather than aggressive market share battles. You see this focus reflected in the capital plan; PPL Corporation has a robust capital plan featuring $20 billion in infrastructure improvements projected through 2028. For the 2025 fiscal year alone, capital investments are planned to be approximately $4.3 billion. Investments like these, aimed at efficiency and resilience, are exactly where Cash Cows should spend their excess cash to maintain productivity and increase future cash flow, rather than on high-growth marketing.
The commitment to shareholders, funded by these steady operations, is clear in the dividend policy. PPL Corporation is focused on delivering visible and predictable returns, which is a hallmark of a mature, cash-generating business unit. Here are the stated targets you should note:
- Targeted annual EPS and dividend growth of 6% to 8% through at least 2028.
- The 2025 ongoing earnings per share forecast midpoint is $1.81 per share, reflecting growth from $1.69 per share in 2024.
- The company expects to achieve EPS growth in the top half of its targeted 6% to 8% range for 2025.
This financial discipline is supported by a strong balance sheet, which is critical for a utility managing massive capital deployment. The company maintains investment-grade credit ratings, signaling low default risk to the market. Honestly, this is what allows them to deploy capital without constantly tapping equity markets. Here's a quick look at the key credit metrics as of mid-2025:
| Metric | PPL Corporation (Parent) | LG&E and KU |
|---|---|---|
| S&P Issuer Rating | A- | Baa1 |
| Moody's Issuer Rating | Baa1 | A3 |
| Outlook | Stable | Stable |
| FFO to Debt Target Range | 16% to 18% | N/A (Parent Target) |
The ratings, such as S&P's A- and Moody's Baa1 for the parent company as of June 30, 2025, confirm the strong position. This strong credit profile supports the $20 billion capital deployment plan. The focus is on maintaining productivity and milking the gains passively, which is why you see the emphasis on infrastructure spending over speculative growth initiatives. The regulated earnings from Kentucky definitely help keep the books balanced; for example, third-quarter 2025 ongoing earnings per share for the whole company was $0.48. You can defintely see the stability in those numbers.
PPL Corporation (PPL) - BCG Matrix: Dogs
The Dogs quadrant in the Boston Consulting Group Matrix represents business units or assets characterized by low market share in low-growth markets. For PPL Corporation, these are typically legacy assets or corporate overhead that consume resources without generating significant, sustainable returns, making them candidates for minimization or divestiture.
Legacy coal-fired generation assets facing planned economic transition and retirement by 2050 represent a clear Dog category due to their mandated phase-out. PPL Corporation has committed to a glidepath to achieve net-zero carbon emissions by 2050, which includes not burning coal unless it can be mitigated with carbon dioxide removal technologies. This strategic direction inherently places existing, non-transitioned coal capacity into a low-growth/declining market position.
Specific asset retirements confirm this trend:
- Mill Creek Unit 1 (300 MW) coal-fired unit was retired in 2024.
- Mill Creek Unit 2 (297 MW) coal-fired unit is expected to be retired in 2027, subject to certain conditions.
Certain non-core or smaller-scale infrastructure that requires maintenance but offers limited growth is often bundled within the overall capital expenditure plan but does not drive the high rate base growth seen in core areas like data center support. While PPL Corporation has a robust \$20 billion capital investment plan through 2028, the older, less efficient infrastructure falls into this category, requiring maintenance spending that yields minimal incremental return compared to new, high-growth investments.
The financial performance of the central administrative function directly reflects a cash-consuming unit:
The Corporate and Other segment incurred a loss from ongoing operations in the second quarter of 2025. This segment's contribution to ongoing Earnings Per Share (EPS) was a loss of (\$0.06) per share in Q2 2025, compared to a loss of (\$0.05) per share in Q2 2024. This decline was attributed to higher interest expense and other unallocated costs.
Older, less efficient parts of the distribution network requiring high O&M before modernization are being addressed through significant capital deployment, but the legacy components themselves represent sunk costs or high maintenance burdens until replaced. PPL Corporation is on track to achieve at least \$150 million of cumulative O&M savings in 2025, suggesting that current O&M costs on older assets are a focus area for reduction. Furthermore, the need for significant rate base recovery highlights the scale of necessary investment in the network:
PPL Electric Utilities filed for a \$356 million increase in annual distribution base rate revenue on September 30, 2025, to fund infrastructure investments, representing an 8.6% increase in the company's total annual revenue. If approved, this would add approximately \$13 per month for a residential customer using 1,000 kilowatt-hours.
Key Financial and Operational Metrics Associated with Potential Dogs:
| Category/Metric | Value/Amount | Timeframe/Context |
| Corporate and Other Segment Ongoing EPS | (\$0.06) per share | Q2 2025 |
| Coal Retirement Target Year | 2050 | Net-zero carbon emissions goal |
| Mill Creek Unit 2 Capacity (Coal) | 297 MW | Expected retirement in 2027 |
| Distribution Base Rate Revenue Increase Sought | \$356 million | Filed September 30, 2025 |
| Residential Customer Impact (Distribution Rate) | \$13 per month | Based on 1,000 kWh usage, if approved |
| Cumulative O&M Savings Target | \$150 million | Achieve in 2025 |
PPL Corporation (PPL) - BCG Matrix: Question Marks
Question Marks
These business units operate in rapidly expanding markets, specifically driven by data center and AI infrastructure demand, but their current contribution to overall earnings is small relative to the required investment, fitting the low market share/high growth profile of a Question Mark.
The Rhode Island Regulated segment (RIE), which includes the regulated electricity and natural gas operations of Rhode Island Energy, shows a minimal current return, reporting an Ongoing Earnings Per Share (EPS) of only $0.01 for the second quarter of 2025. This low figure, compared to the total PPL Q2 2025 Ongoing EPS of $0.32, highlights a segment that may be consuming cash or not yet realizing the returns from recent capital deployment, placing it in a position needing strategic review or heavy investment to move toward Star status.
PPL Corporation is actively investing in high-growth areas through strategic partnerships and capital projects, which consume significant cash now for potential future dominance:
- The joint venture with Blackstone Infrastructure, formed on July 15, 2025, will develop new gas-fired, combined-cycle generation stations in Pennsylvania to power data centers.
- PPL holds a 51% controlling stake in the venture, with Blackstone holding 49%.
- This venture is a direct response to PPL estimating a potential shortfall of 6 GW within five to six years if the 13 GW of planned data centers materialize, representing a potential $15 billion need for new generation.
- PPL is on track to complete over $4 billion of infrastructure improvements in 2025 as part of its overall capital plan.
The Kentucky expansion represents another major cash-consuming, high-growth market play, though the specific components have evolved:
| Project Component | Capacity/Investment | Status/Availability |
| New Natural Gas Units (Two) | 1.3 GW total (Two 645 MW units) | Expected in 2030 and 2031 |
| Total Proposed Investment | $3.7 billion | Requested approval on February 28, 2025 |
| Battery Storage | 400 MW initially proposed | Request was withdrawn in the July 29, 2025 stipulation agreement |
The need for this capacity is driven by unprecedented economic growth, with PPL's Kentucky utilities anticipating a load increase of 2,000 megawatts between now and 2032.
The focus on early-stage technology deployment is the mechanism PPL Corporation is using to quickly gain market share and operational efficiency, which is critical for Question Marks:
- PPL reaffirmed a total capital investment plan of $20 billion spanning from 2025 to 2028, targeting an average annual rate base growth of 9.8%.
- The active data center load request pipeline in Pennsylvania alone surged to 20.5 GW by November 2025.
- The company is on track to achieve at least $150 million of cumulative Operations & Maintenance (O&M) savings by 2025, relative to the 2021 baseline.
- PPL maintains its long-term guidance of 6% to 8% annual EPS and dividend growth through at least 2028.
These large, unproven investments in new generation capacity, while necessary for high-growth markets, represent significant cash consumption today without guaranteed immediate returns, defining their Question Mark status.
Disclaimer
All information, articles, and product details provided on this website are for general informational and educational purposes only. We do not claim any ownership over, nor do we intend to infringe upon, any trademarks, copyrights, logos, brand names, or other intellectual property mentioned or depicted on this site. Such intellectual property remains the property of its respective owners, and any references here are made solely for identification or informational purposes, without implying any affiliation, endorsement, or partnership.
We make no representations or warranties, express or implied, regarding the accuracy, completeness, or suitability of any content or products presented. Nothing on this website should be construed as legal, tax, investment, financial, medical, or other professional advice. In addition, no part of this site—including articles or product references—constitutes a solicitation, recommendation, endorsement, advertisement, or offer to buy or sell any securities, franchises, or other financial instruments, particularly in jurisdictions where such activity would be unlawful.
All content is of a general nature and may not address the specific circumstances of any individual or entity. It is not a substitute for professional advice or services. Any actions you take based on the information provided here are strictly at your own risk. You accept full responsibility for any decisions or outcomes arising from your use of this website and agree to release us from any liability in connection with your use of, or reliance upon, the content or products found herein.