
|
Progress Software Corporation (PRGS): ANSOFF MATRIX [Apr-2026 Updated] |
Fully Editable: Tailor To Your Needs In Excel Or Sheets
Professional Design: Trusted, Industry-Standard Templates
Investor-Approved Valuation Models
MAC/PC Compatible, Fully Unlocked
No Expertise Is Needed; Easy To Follow
Progress Software Corporation (PRGS) Bundle
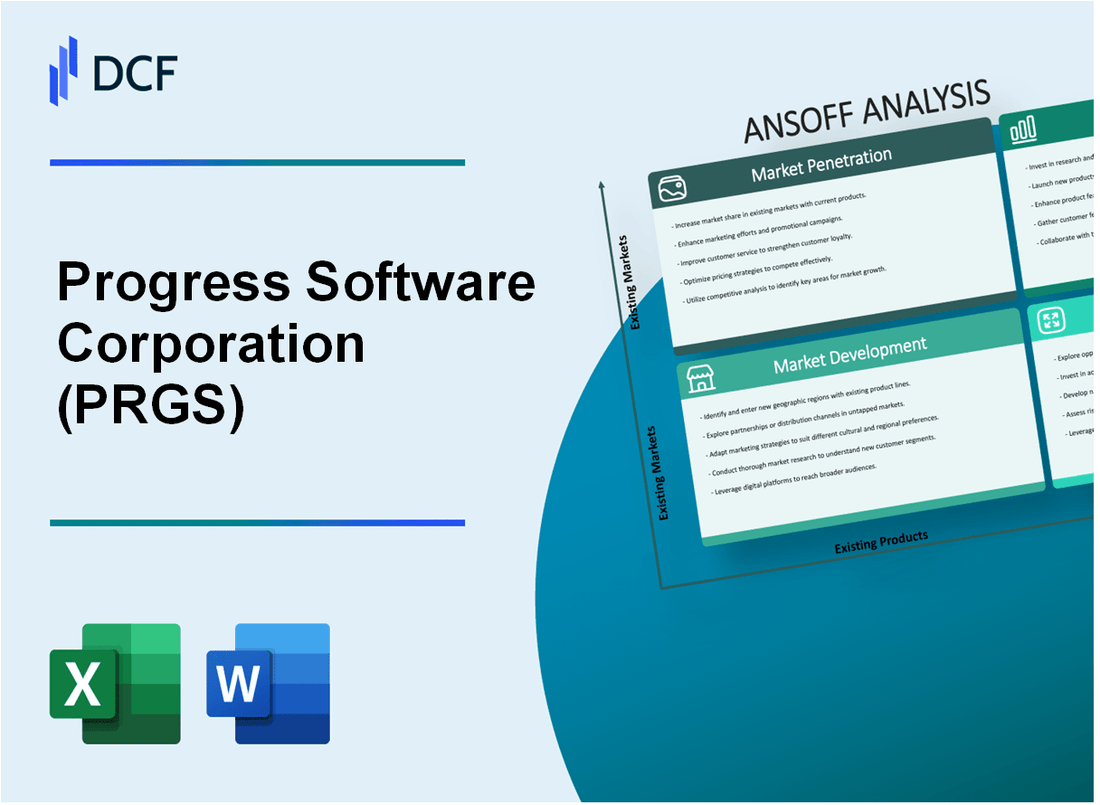
You're looking at Progress Software Corporation's strong 2025 financial footing-they banked on 100% Net Retention Rate and are sitting on $232 million to $242 million in free cash flow-and need to know exactly where the growth comes from next. Honestly, this Ansoff Matrix lays out a clear playbook, moving from boosting existing sales by cross-selling ShareFile to making bold, $1.5 billion-backed diversification moves into new areas like the $197.11 billion system infrastructure software market. I've mapped out the four clear paths below, showing you the concrete actions they are taking right now to turn that cash into market share, so you can see the near-term opportunities and risks defintely.
Progress Software Corporation (PRGS) - Ansoff Matrix: Market Penetration
You're looking at how Progress Software Corporation (PRGS) can wring more value from the customers and markets it already serves. This is Market Penetration, and for a company with a strong recurring base, it's about deepening those relationships.
The immediate focus has to be on expanding spend within the existing installed base. You saw the Net Retention Rate (NRR) hold steady at 100% for the second quarter of fiscal year 2025, ending May 31, 2025. 100% NRR means that, before adding any new logos, the existing customers spent exactly what they did the year prior-no expansion, no contraction. To boost existing customer spend, you need that NRR to climb past 100%, maybe targeting 105% or higher. That's where the real leverage is, especially since Annualized Recurring Revenue (ARR) hit $838 million in Q2 2025, showing 46% year-over-year growth.
The recent acquisition of ShareFile is a prime lever for this strategy. Progress Software paid $875 million for the platform. This move brings over 86,000 new customers, with an average revenue per customer around $3,000. The goal now is to drive cross-selling of ShareFile's SaaS capabilities into the core Progress Software customer base, which already has a customer count 'more than double' the 86,000 from ShareFile. The integration is reportedly going well, having passed 'numerous major synergy milestones'. If you can successfully attach ShareFile to just a fraction of the existing base, that NRR will jump significantly, as ShareFile is expected to contribute over $240 million in annual revenue.
Here's a look at the revenue anchors you're trying to penetrate deeper:
| Revenue Component | Amount (Last Year) | Percentage of Total Revenue (Last Year) |
| Maintenance Revenue | $410.56 million | Approximately 54.5% |
| Total Revenue | $753.41 million | 100% |
Securing that maintenance revenue is key, as it's the bedrock of the business. Launching a loyalty program is a direct action to secure this anchor, aiming to minimize any potential attrition that would drag the NRR below 100%.
On the geographic front, the US market remains the largest single contributor, which means expanding sales force coverage there is a high-impact move. In fiscal year 2024, North America generated 59% of total revenue. That translated to $421.89 million in US revenue in the last reported year. If you're adding headcount, concentrating those new sales resources in the US is logical, given that region's revenue share is well over half of the total.
For the legacy OpenEdge platform, capturing share from competitors requires sharp incentives. While I don't have the specific 2025 pricing sheets, the strategy must be about targeted pricing and bundles. This is about making the cost of staying with a legacy competitor higher than the cost of upgrading or expanding within the Progress Software ecosystem. You're selling into a base that generated $410.56 million in maintenance revenue last year, so even small upsell percentages translate to big dollar amounts.
You need to track the NRR improvement against the ShareFile cross-sell velocity. Finance: model the impact on NRR if ShareFile attaches to 15% of the existing customer base in the next two quarters.
Progress Software Corporation (PRGS) - Ansoff Matrix: Market Development
You're looking at how Progress Software Corporation can push its existing products into new territories or customer segments. This Market Development strategy hinges on expanding reach where the core technology is already proven.
For EMEA (Europe, Middle East, and Africa), the focus is on deepening channel penetration. In fiscal year 2024, EMEA contributed 33% of Progress Software Corporation's total revenue, which amounted to $245,287 thousand. This region saw a reported revenue growth of 10% year-over-year in FY2024. To accelerate this, Progress Software is building on recent channel moves, like the partnership established in Romania with Infinigate. Remember, nearly half of the worldwide revenue is realized through indirect channel partners, including distributors and VARs, making channel expansion a critical lever for growth outside North America.
The ambition here is to grow the EMEA revenue contribution beyond the current baseline of one-third. Progress Software is recognized as ideal for midsize organizations, which suggests a specific focus on the European mid-market enterprises is a logical step to push that 33% figure higher.
Progress Software Corporation's overall revenue for the third quarter of fiscal year 2025 hit $250 million. The full-year 2025 revenue guidance has been raised to a range of $975 million to $981 million.
Here's a look at the geographic revenue context from fiscal year 2024:
| Region | FY 2024 Revenue (in thousands) | FY 2024 Revenue Percentage |
| North America | $446,995 | 59% |
| EMEA | $245,287 | 33% |
| Latin America | $20,305 | 3% |
| Asia Pacific | $40,822 | 5% |
The Asia Pacific region, representing 5% of total revenue in fiscal year 2024, is a key target for the Sitefinity Digital Experience Platform (DXP) localization efforts. Sitefinity already includes features like region-specific content localization to manage and deliver content efficiently. This aligns with the broader market trend, as the Asia Pacific segment of the Global Software Development Market is projected to be the fastest growing region, holding an estimated share of 27.8% in 2025.
Another avenue for market development involves expanding the customer base from the existing user pool. Over 4 million developers and technologists at hundreds of thousands of enterprises currently depend on Progress Software tools. The strategic action is to convert a larger portion of these developers into enterprise license customers. This is crucial because the enterprise software segment is expected to lead the global software development market, holding an estimated share of 39.4% in 2025.
The DataDirect connectivity suite is part of the Progress Data Platform, and Progress Software has cloud-based offerings that utilize a subscription-based model. Introducing a cloud-hosted version of DataDirect to new, cloud-first geographies is a direct market development play. This strategy taps into the general market shift, as cloud computing remains a key area of focus in core business strategies for 2025.
Key metrics supporting the growth strategy include:
- Annualized Recurring Revenue (ARR) reached $849 million as of Q3 2025.
- Net retention rates remained strong at 100% in Q3 2025.
- The company raised its full-year 2025 revenue guidance to $975 million to $981 million.
- The ShareFile acquisition, which contributes to top-line results, was successfully integrated.
Finance: draft 13-week cash view by Friday.
Progress Software Corporation (PRGS) - Ansoff Matrix: Product Development
You're looking at how Progress Software Corporation (PRGS) is planning to grow by developing new offerings, which is the Product Development quadrant of the Ansoff Matrix. This involves integrating recent acquisitions and funding internal innovation from its projected cash generation.
Progress Software Corporation is rapidly integrating the Nuclia RAG AI acquisition, which was signed and closed on June 30, 2025. The purchase price was undisclosed but floated around $50 million. This technology is intended to enhance multiple Progress product lines with advanced AI capabilities, specifically agentic RAG (Retrieval-Augmented Generation) features to help existing customers speed up their own GenAI initiatives.
The company is developing new AI-powered features, building on the momentum from the ShareFile acquisition, which is expected to contribute approximately $250 million in revenue for fiscal year 2025. The ShareFile acquisition itself cost $875 million and brought over 86,000 customers. In Q3 2025, ShareFile added approximately $260 million to the Annualized Recurring Revenue (ARR), which reached $849 million. Progress Software's SaaS capabilities now contribute nearly 30% of total revenue.
Progress Software Corporation projects an adjusted free cash flow for fiscal year 2025 between $232 million and $242 million. A portion of this is intended for organic Research and Development (R&D) to build new product modules, as the company continuously evolves its portfolio through ongoing product innovation fueled by significant R&D investments. The company's Q3 2025 revenue was $250 million.
The strategy includes building a unified, subscription-based cloud platform that seamlessly combines infrastructure and Digital Experience Platform (DXP) offerings. The Nuclia acquisition is specifically aimed at extending the end-to-end value of the Progress Data Platform.
Progress Software Corporation's product portfolio already includes Progress MOVEit, which addresses security needs. The company is focused on launching new security products that leverage the expertise gained from the MOVEit acquisition to address new cyber threats.
Here is a look at key financial and operational metrics supporting this product development focus:
| Metric | Value | Context/Period |
| Projected FY2025 Adjusted Free Cash Flow (Low) | $232 million | FY2025 Guidance |
| Projected FY2025 Adjusted Free Cash Flow (High) | $242 million | FY2025 Guidance |
| ShareFile FY2025 Projected Revenue Contribution | $250 million | FY2025 Outlook |
| ShareFile Acquisition Cost | $875 million | Acquisition Price |
| Nuclia Acquisition Estimate | $50 million | Reported Estimate |
| Q3 2025 Revenue | $250 million | Q3 2025 Results |
| Q3 2025 ARR | $849 million | Q3 2025 Results |
| ShareFile ARR Contribution (Q3 2025) | $260 million | Q3 2025 Results |
| ShareFile Customer Base Added | 86,000+ | Acquisition Detail |
The Product Development strategy relies on integrating these new capabilities, as shown by the following planned actions:
- Rapidly integrate the Nuclia RAG AI acquisition into existing products to enhance GenAI capabilities.
- Develop new AI-powered features, like the ShareFile document assistant, to drive expansion revenue.
- Invest a portion of the projected $232 million to $242 million adjusted free cash flow into organic R&D for new product modules.
- Build a unified, subscription-based cloud platform that seamlessly combines infrastructure and DXP offerings.
- Launch a new security product that leverages the MOVEit acquisition's expertise to address new cyber threats.
Progress Software serves 70% of the Fortune 500 and has over 200K+ organizations running on its products.
Finance: draft 13-week cash view by Friday.
Progress Software Corporation (PRGS) - Ansoff Matrix: Diversification
You're looking at the most aggressive growth quadrant here, Diversification, where Progress Software Corporation (PRGS) would be chasing entirely new markets with entirely new products. This is where you deploy capital for maximum potential upside, but also where the execution risk is highest.
Executing Large, Non-Adjacent M&A for New Markets
The financial flexibility to execute a large, non-adjacent Merger and Acquisition (M&A) deal is definitely present. Progress Software Corporation recently amended its revolving credit facility in July 2025, increasing its borrowing capacity from $900 million to $1.5 billion. This expanded liquidity is explicitly intended to support the Total Growth Strategy through additional accretive acquisitions. As of August 2025, the total debt on the balance sheet stood at $1.45 Billion USD, down from $1.56 B at the end of fiscal year 2024. This $1.5 billion capacity gives Progress a significant war chest for a transformative, non-adjacent purchase outside its current core software product lines.
Here's a quick look at the financial context supporting this M&A posture:
| Metric | Value (As of Latest Data) | Context |
| Revolver Capacity (New) | $1.5 billion | Increased in July 2025 for growth strategy. |
| Total Debt (Aug 2025) | $1.45 Billion USD | Total debt on the balance sheet. |
| FY 2025 Revenue Guidance (Full Year) | $975 million to $981 million | Guidance provided in Q3 2025 earnings. |
| FY 2024 Revenue | $753 million | Reported revenue for the prior fiscal year. |
Standalone SaaS Launch for the SMB Segment via Nuclia
Launching a standalone, self-service Software as a Service (SaaS) product aimed squarely at the Small to Mid-sized Business (SMB) market represents a clear diversification into a new customer segment. Progress Software recently acquired Nuclia in June/July 2025, an innovator in agentic Retrieval-Augmented Generation (RAG) AI solutions. Nuclia's offering is described as an easy-to-use, self-service SaaS product democratizing access to trustworthy GenAI for both small and mid-sized businesses, as well as large corporations. To be fair, the acquisition itself was stated as immaterial to Progress's financials upon closing. Still, this move establishes a beachhead in a new go-to-market motion focused on self-service adoption within the SMB space, complementing the existing enterprise focus. Progress Software's SaaS capabilities were already contributing nearly 30% of total revenue as of Q1 2025. This new product line, based on Nuclia's technology, is designed to be accessible without significant upfront investment.
Entering the System Infrastructure Software Market
Entering the rapidly growing system infrastructure software market with a new, purpose-built cloud security suite targets a massive, new product category for Progress Software Corporation. The global system infrastructure software market size was calculated at USD 197.11 billion in 2025. This market is projected to reach USD 425.64 billion by 2034, expanding at a Compound Annual Growth Rate (CAGR) of 8.93% over that period. Specifically, the security segment within this market is predicted to grow at a CAGR of 9.38% from 2025 to 2034, suggesting a high-growth area for a new security offering. Progress Software's existing network infrastructure monitoring software, WhatsUp Gold, provides some adjacency, but a purpose-built cloud security suite would be a new product line in this large market.
Vertical Acquisition in FinTech or HealthTech
Acquiring a company in the FinTech or HealthTech vertical would secure immediate access to a specialized customer base, a classic diversification play. The company's stated capital allocation policy emphasizes accretive M&A to expand the business and drive stockholder returns. With the $1.5 billion revolver capacity, Progress Software has the means to pursue a strategic tuck-in acquisition in one of these highly regulated, high-value sectors. The recent Q2 2025 Annualized Recurring Revenue (ARR) stood at $838 million, showing strong existing recurring revenue momentum that such an acquisition could augment. The challenge, as noted in past filings, involves the difficulties of assimilating operations and realizing the value relative to the price paid, especially in specialized verticals.
Consider the following strategic options for this vertical move:
- Target a FinTech firm with compliance automation software.
- Acquire a HealthTech player specializing in secure data exchange.
- Use the $1.5 billion capacity for a deal outside current sectors.
- Focus on targets that enhance the Progress Data Platform integration.
Disclaimer
All information, articles, and product details provided on this website are for general informational and educational purposes only. We do not claim any ownership over, nor do we intend to infringe upon, any trademarks, copyrights, logos, brand names, or other intellectual property mentioned or depicted on this site. Such intellectual property remains the property of its respective owners, and any references here are made solely for identification or informational purposes, without implying any affiliation, endorsement, or partnership.
We make no representations or warranties, express or implied, regarding the accuracy, completeness, or suitability of any content or products presented. Nothing on this website should be construed as legal, tax, investment, financial, medical, or other professional advice. In addition, no part of this site—including articles or product references—constitutes a solicitation, recommendation, endorsement, advertisement, or offer to buy or sell any securities, franchises, or other financial instruments, particularly in jurisdictions where such activity would be unlawful.
All content is of a general nature and may not address the specific circumstances of any individual or entity. It is not a substitute for professional advice or services. Any actions you take based on the information provided here are strictly at your own risk. You accept full responsibility for any decisions or outcomes arising from your use of this website and agree to release us from any liability in connection with your use of, or reliance upon, the content or products found herein.