
|
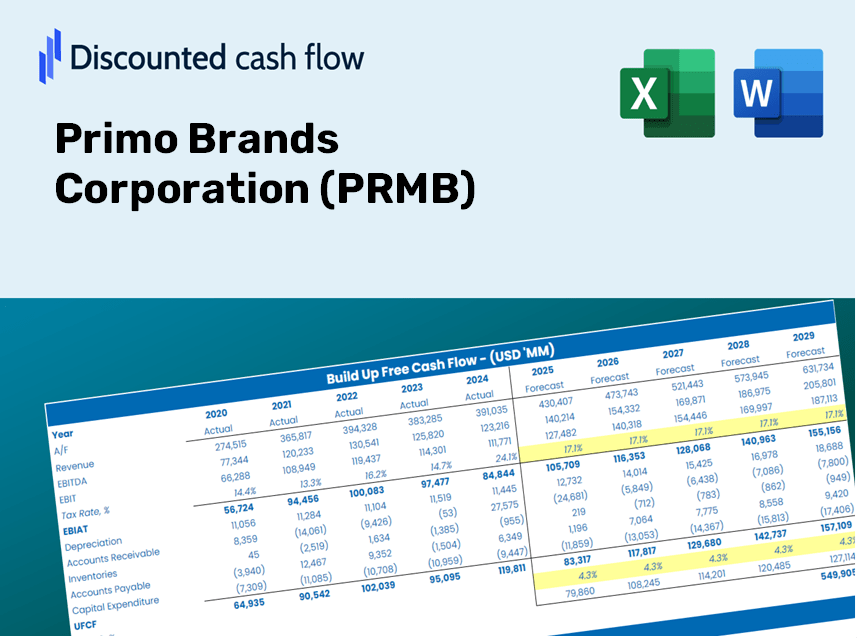
Primo Brands Corporation (PRMB) DCF Valuation |
Fully Editable: Tailor To Your Needs In Excel Or Sheets
Professional Design: Trusted, Industry-Standard Templates
Investor-Approved Valuation Models
MAC/PC Compatible, Fully Unlocked
No Expertise Is Needed; Easy To Follow
Primo Brands Corporation (PRMB) Bundle
Engineered for accuracy, our Primo Brands Corporation (PRMB) DCF Calculator enables you to evaluate the valuation of Primo Brands Corporation with real-world financial data and complete flexibility to modify all essential parameters for improved projections.
Benefits of Choosing Primo Brands Corporation (PRMB)
- Adjustable Forecast Parameters: Effortlessly modify key assumptions (growth %, margins, WACC) to explore various scenarios.
- Comprehensive Market Data: Primo's financial information pre-loaded to kickstart your evaluation process.
- Automated DCF Calculations: The template computes Net Present Value (NPV) and intrinsic value automatically.
- Tailored and Professional Design: An advanced Excel model that aligns with your valuation requirements.
- Designed for Analysts and Investors: Perfect for assessing forecasts, verifying strategies, and enhancing efficiency.
Essential Features
- Comprehensive DCF Calculator: Offers detailed unlevered and levered DCF valuation frameworks.
- WACC Calculator: Features a ready-to-use Weighted Average Cost of Capital template with adjustable inputs.
- Customizable Forecast Assumptions: Adjust growth projections, capital expenditures, and discount rates as needed.
- Integrated Financial Ratios: Evaluate profitability, leverage, and efficiency ratios specifically for Primo Brands Corporation (PRMB).
- Interactive Dashboard and Charts: Visual representations present key valuation metrics for straightforward analysis.
How It Functions
- 1. Access the Template: Download and open the Excel file featuring Primo Brands Corporation’s (PRMB) preloaded data.
- 2. Modify Assumptions: Adjust essential inputs such as growth rates, WACC, and capital expenditures.
- 3. View Results in Real-Time: The DCF model calculates intrinsic value and NPV dynamically.
- 4. Experiment with Scenarios: Evaluate various forecasts to explore different valuation possibilities.
- 5. Utilize with Assurance: Present expert valuation insights to bolster your decision-making.
Why Opt for the Primo Brands Corporation (PRMB) Calculator?
- Time Efficient: Jump straight into calculations with a pre-built DCF model at your fingertips.
- Enhanced Accuracy: Dependable financial data and algorithms minimize valuation errors.
- Completely Customizable: Adapt the model to align with your unique assumptions and forecasts.
- User-Friendly: Intuitive charts and outputs facilitate easy analysis of results.
- Preferred by Professionals: Crafted for experts who prioritize both precision and functionality.
Who Should Benefit from Primo Brands Corporation (PRMB)?
- Individual Investors: Gain insights to make informed decisions regarding the purchase or sale of Primo Brands Corporation (PRMB) shares.
- Financial Analysts: Enhance valuation processes with easily accessible financial models tailored for Primo Brands Corporation (PRMB).
- Consultants: Provide clients with accurate and timely valuation analysis for Primo Brands Corporation (PRMB).
- Business Owners: Learn how established companies like Primo Brands Corporation (PRMB) are evaluated to inform your own business strategies.
- Finance Students: Acquire practical knowledge of valuation methods using real data and scenarios related to Primo Brands Corporation (PRMB).
Contents of the Template
- Historical Data: Includes Primo Brands Corporation's (PRMB) previous financial performance and foundational forecasts.
- DCF and Levered DCF Models: Comprehensive templates for determining the intrinsic value of Primo Brands Corporation (PRMB).
- WACC Sheet: Pre-calculated metrics for the Weighted Average Cost of Capital.
- Editable Inputs: Adjust essential drivers such as growth rates, EBITDA percentages, and CAPEX estimates.
- Quarterly and Annual Statements: A thorough analysis of Primo Brands Corporation's (PRMB) financial data.
- Interactive Dashboard: Dynamically visualize valuation results and forecasts.
Disclaimer
All information, articles, and product details provided on this website are for general informational and educational purposes only. We do not claim any ownership over, nor do we intend to infringe upon, any trademarks, copyrights, logos, brand names, or other intellectual property mentioned or depicted on this site. Such intellectual property remains the property of its respective owners, and any references here are made solely for identification or informational purposes, without implying any affiliation, endorsement, or partnership.
We make no representations or warranties, express or implied, regarding the accuracy, completeness, or suitability of any content or products presented. Nothing on this website should be construed as legal, tax, investment, financial, medical, or other professional advice. In addition, no part of this site—including articles or product references—constitutes a solicitation, recommendation, endorsement, advertisement, or offer to buy or sell any securities, franchises, or other financial instruments, particularly in jurisdictions where such activity would be unlawful.
All content is of a general nature and may not address the specific circumstances of any individual or entity. It is not a substitute for professional advice or services. Any actions you take based on the information provided here are strictly at your own risk. You accept full responsibility for any decisions or outcomes arising from your use of this website and agree to release us from any liability in connection with your use of, or reliance upon, the content or products found herein.