
|
Prism Johnson Limited (PRSMJOHNSN.NS) DCF Valuation |
Fully Editable: Tailor To Your Needs In Excel Or Sheets
Professional Design: Trusted, Industry-Standard Templates
Investor-Approved Valuation Models
MAC/PC Compatible, Fully Unlocked
No Expertise Is Needed; Easy To Follow
Prism Johnson Limited (PRSMJOHNSN.NS) Bundle
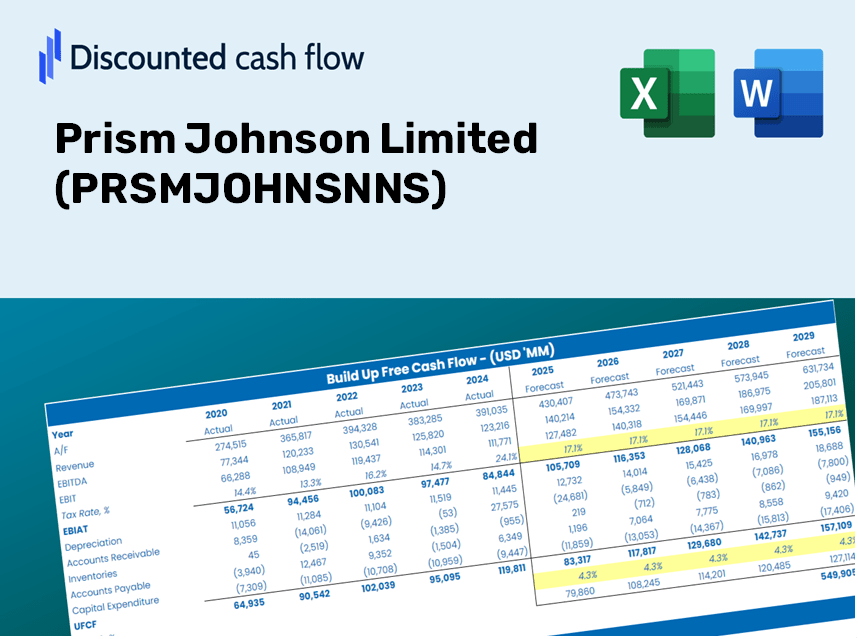
Simplify Prism Johnson Limited (PRSMJOHNSNNS) valuation with this customizable DCF Calculator! Featuring real Prism Johnson Limited financials and adjustable forecast inputs, you can test scenarios and uncover Prism Johnson Limited's fair value in minutes.
Discounted Cash Flow (DCF) - (USD MM)
| Year | AY1 2021 |
AY2 2022 |
AY3 2023 |
AY4 2024 |
AY5 2025 |
FY1 2026 |
FY2 2027 |
FY3 2028 |
FY4 2029 |
FY5 2030 |
|---|---|---|---|---|---|---|---|---|---|---|
| Revenue | 55,871.4 | 63,064.2 | 73,605.2 | 73,941.8 | 73,102.1 | 78,385.6 | 84,051.0 | 90,125.8 | 96,639.7 | 103,624.4 |
| Revenue Growth, % | 0 | 12.87 | 16.71 | 0.4573 | -1.14 | 7.23 | 7.23 | 7.23 | 7.23 | 7.23 |
| EBITDA | 6,618.9 | 5,715.0 | 3,991.8 | 7,741.0 | 4,183.6 | 6,666.6 | 7,148.4 | 7,665.0 | 8,219.0 | 8,813.1 |
| EBITDA, % | 11.85 | 9.06 | 5.42 | 10.47 | 5.72 | 8.5 | 8.5 | 8.5 | 8.5 | 8.5 |
| Depreciation | 2,925.2 | 3,096.5 | 3,900.6 | 4,138.0 | 4,834.2 | 4,335.4 | 4,648.7 | 4,984.7 | 5,345.0 | 5,731.3 |
| Depreciation, % | 5.24 | 4.91 | 5.3 | 5.6 | 6.61 | 5.53 | 5.53 | 5.53 | 5.53 | 5.53 |
| EBIT | 3,693.7 | 2,618.5 | 91.2 | 3,603.0 | -650.6 | 2,331.2 | 2,499.7 | 2,680.3 | 2,874.0 | 3,081.8 |
| EBIT, % | 6.61 | 4.15 | 0.1239 | 4.87 | -0.88999 | 2.97 | 2.97 | 2.97 | 2.97 | 2.97 |
| Total Cash | 6,938.8 | 4,074.7 | 4,040.6 | 6,618.7 | 5,311.6 | 6,362.9 | 6,822.8 | 7,315.9 | 7,844.7 | 8,411.7 |
| Total Cash, percent | .0 | .0 | .0 | .0 | .0 | .0 | .0 | .0 | .0 | .0 |
| Account Receivables | 6,932.1 | 6,921.7 | 7,812.4 | 6,947.3 | 8,396.2 | 8,603.3 | 9,225.1 | 9,891.9 | 10,606.8 | 11,373.4 |
| Account Receivables, % | 12.41 | 10.98 | 10.61 | 9.4 | 11.49 | 10.98 | 10.98 | 10.98 | 10.98 | 10.98 |
| Inventories | 5,805.0 | 8,048.6 | 7,475.8 | 8,255.6 | 7,738.3 | 8,631.8 | 9,255.6 | 9,924.6 | 10,641.9 | 11,411.1 |
| Inventories, % | 10.39 | 12.76 | 10.16 | 11.16 | 10.59 | 11.01 | 11.01 | 11.01 | 11.01 | 11.01 |
| Accounts Payable | 9,457.6 | 11,379.3 | 12,459.8 | 10,363.9 | 14,854.2 | 13,519.2 | 14,496.3 | 15,544.1 | 16,667.5 | 17,872.2 |
| Accounts Payable, % | 16.93 | 18.04 | 16.93 | 14.02 | 20.32 | 17.25 | 17.25 | 17.25 | 17.25 | 17.25 |
| Capital Expenditure | -2,295.3 | -3,676.9 | -3,691.0 | -4,951.8 | -3,888.9 | -4,228.1 | -4,533.7 | -4,861.4 | -5,212.7 | -5,589.5 |
| Capital Expenditure, % | -4.11 | -5.83 | -5.01 | -6.7 | -5.32 | -5.39 | -5.39 | -5.39 | -5.39 | -5.39 |
| Tax Rate, % | -1672.28 | -1672.28 | -1672.28 | -1672.28 | -1672.28 | -1672.28 | -1672.28 | -1672.28 | -1672.28 | -1672.28 |
| EBITAT | 4,040.3 | 2,863.1 | 53.0 | 3,744.0 | -11,530.5 | 2,135.6 | 2,290.0 | 2,455.5 | 2,633.0 | 2,823.3 |
| Depreciation | ||||||||||
| Changes in Account Receivables | ||||||||||
| Changes in Inventories | ||||||||||
| Changes in Accounts Payable | ||||||||||
| Capital Expenditure | ||||||||||
| UFCF | 1,390.7 | 1,971.2 | 1,025.2 | 919.6 | -7,026.5 | -192.6 | 2,136.5 | 2,290.9 | 2,456.5 | 2,634.0 |
| WACC, % | 7.46 | 7.46 | 6.46 | 7.46 | 7.46 | 7.26 | 7.26 | 7.26 | 7.26 | 7.26 |
| PV UFCF | ||||||||||
| SUM PV UFCF | 7,245.1 | |||||||||
| Long Term Growth Rate, % | 4.00 | |||||||||
| Free cash flow (T + 1) | 2,739 | |||||||||
| Terminal Value | 84,010 | |||||||||
| Present Terminal Value | 59,174 | |||||||||
| Enterprise Value | 66,419 | |||||||||
| Net Debt | 10,279 | |||||||||
| Equity Value | 56,140 | |||||||||
| Diluted Shares Outstanding, MM | 503 | |||||||||
| Equity Value Per Share | 111.68 |
What Awaits You
- Customizable Excel Template: A fully editable Excel-based DCF Calculator featuring pre-populated financial data for Prism Johnson Limited (PRSMJOHNSNNS).
- Comprehensive Data: Access to historical data and projected estimates (highlighted in the yellow cells).
- Flexible Forecasting: Modify key assumptions such as revenue growth, EBITDA percentage, and WACC at your discretion.
- Instant Calculations: Observe real-time changes to Prism Johnson’s valuation based on your inputs.
- Professional Resource: Designed for use by investors, CFOs, consultants, and financial analysts.
- Intuitive Layout: Organized for ease of use and clarity, featuring step-by-step guidance.
Key Features
- Comprehensive DCF Calculator: Features detailed unlevered and levered DCF valuation models specifically for Prism Johnson Limited (PRSMJOHNSNNS).
- WACC Calculator: A pre-configured Weighted Average Cost of Capital sheet that allows for customizable input options.
- Adjustable Forecast Assumptions: Tailor growth rates, capital expenditures, and discount rates to your needs.
- Integrated Financial Ratios: Evaluate profitability, leverage, and efficiency ratios for Prism Johnson Limited (PRSMJOHNSNNS).
- Visual Dashboard and Charts: Graphical representations that summarize essential valuation metrics for straightforward analysis.
How It Works
- Step 1: Download the Excel file.
- Step 2: Examine the pre-filled data for Prism Johnson Limited (PRSMJOHNSNNS) covering both historical and projected figures.
- Step 3: Modify key assumptions (highlighted in yellow) based on your evaluation.
- Step 4: Observe the automatic updates reflecting the intrinsic value of Prism Johnson Limited (PRSMJOHNSNNS).
- Step 5: Utilize the results for your investment strategies or reporting needs.
Why Choose Prism Johnson Limited (PRSMJOHNSN)?
- Precision: Reliance on actual Prism Johnson financials ensures data reliability.
- Versatility: Built for users to easily experiment with and adjust inputs.
- Efficiency: Eliminate the difficulty of creating a financial model from the ground up.
- High-Quality: Crafted with the expertise and usability standards expected at the CFO level.
- Intuitive: User-friendly design caters to both experienced and novice financial modelers.
Who Should Use This Product?
- Individual Investors: Gain the knowledge needed to make savvy decisions regarding investments in Prism Johnson Limited (PRSMJOHNSNNS).
- Financial Analysts: Enhance your valuation processes with efficient, ready-to-implement financial models tailored for Prism Johnson Limited (PRSMJOHNSNNS).
- Consultants: Provide your clients with expert valuation insights for Prism Johnson Limited (PRSMJOHNSNNS) quickly and accurately.
- Business Owners: Learn how the valuation methods of large entities like Prism Johnson Limited (PRSMJOHNSNNS) can inform and improve your own business strategies.
- Finance Students: Explore and master valuation techniques using real data and examples from Prism Johnson Limited (PRSMJOHNSNNS).
What the Template Includes
- Preloaded PRSMJOHNSNNS Data: Historical and projected financial information, encompassing revenue, EBIT, and capital expenditures.
- DCF and WACC Models: Professional-quality spreadsheets designed for calculating intrinsic value and Weighted Average Cost of Capital.
- Editable Inputs: Yellow-highlighted cells for customizing revenue growth, tax rates, and discount rates.
- Financial Statements: Detailed annual and quarterly financials for in-depth analysis.
- Key Ratios: Profitability, leverage, and efficiency ratios for performance evaluation.
- Dashboard and Visuals: Graphical summaries of valuation results and assumptions.
Disclaimer
All information, articles, and product details provided on this website are for general informational and educational purposes only. We do not claim any ownership over, nor do we intend to infringe upon, any trademarks, copyrights, logos, brand names, or other intellectual property mentioned or depicted on this site. Such intellectual property remains the property of its respective owners, and any references here are made solely for identification or informational purposes, without implying any affiliation, endorsement, or partnership.
We make no representations or warranties, express or implied, regarding the accuracy, completeness, or suitability of any content or products presented. Nothing on this website should be construed as legal, tax, investment, financial, medical, or other professional advice. In addition, no part of this site—including articles or product references—constitutes a solicitation, recommendation, endorsement, advertisement, or offer to buy or sell any securities, franchises, or other financial instruments, particularly in jurisdictions where such activity would be unlawful.
All content is of a general nature and may not address the specific circumstances of any individual or entity. It is not a substitute for professional advice or services. Any actions you take based on the information provided here are strictly at your own risk. You accept full responsibility for any decisions or outcomes arising from your use of this website and agree to release us from any liability in connection with your use of, or reliance upon, the content or products found herein.