
|
PermRock Royalty Trust (PRT) DCF Valuation |
Fully Editable: Tailor To Your Needs In Excel Or Sheets
Professional Design: Trusted, Industry-Standard Templates
Investor-Approved Valuation Models
MAC/PC Compatible, Fully Unlocked
No Expertise Is Needed; Easy To Follow
PermRock Royalty Trust (PRT) Bundle
Looking to assess the intrinsic value of PermRock Royalty Trust (PRT)? Our (PRT) DCF Calculator integrates real-world data with extensive customization features, enabling you to refine your forecasts and enhance your investment strategies.
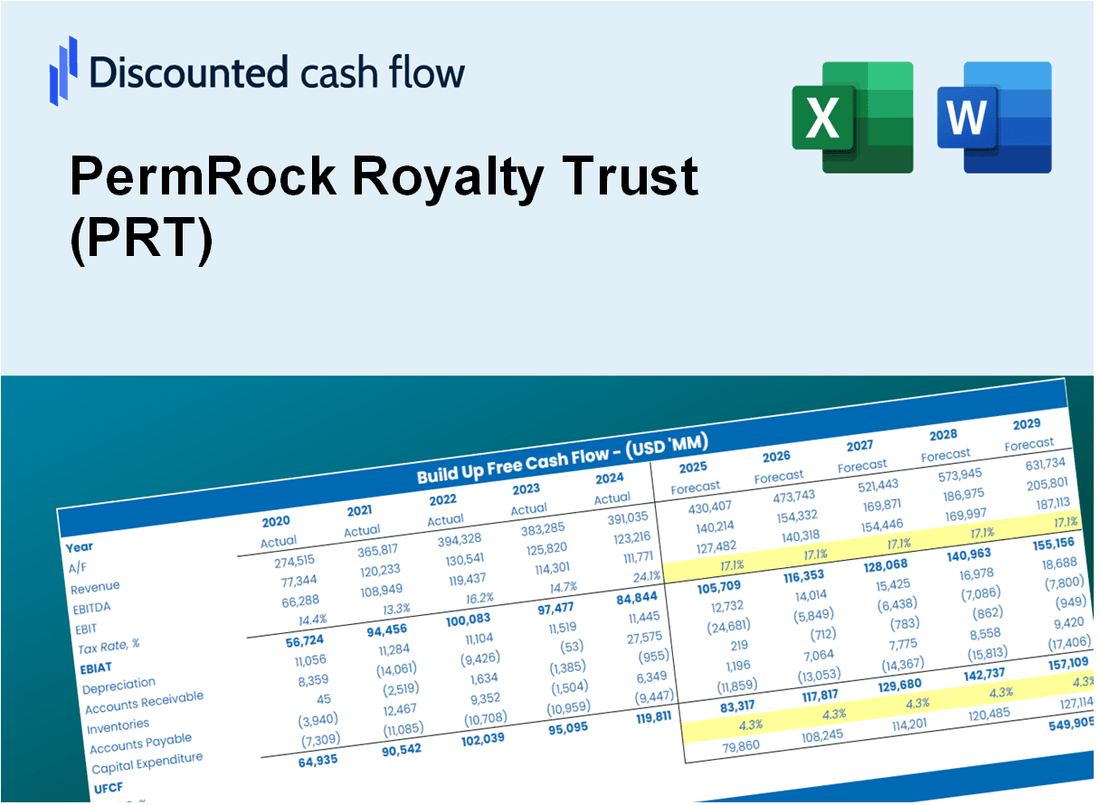
Discounted Cash Flow (DCF) - (USD MM)
| Year | AY1 2020 |
AY2 2021 |
AY3 2022 |
AY4 2023 |
AY5 2024 |
FY1 2025 |
FY2 2026 |
FY3 2027 |
FY4 2028 |
FY5 2029 |
|---|---|---|---|---|---|---|---|---|---|---|
| Revenue | 3.2 | 8.1 | 13.2 | 7.2 | 6.0 | 7.5 | 9.4 | 11.8 | 14.7 | 18.4 |
| Revenue Growth, % | 0 | 155.47 | 61.79 | -45.47 | -16.25 | 25.02 | 25.02 | 25.02 | 25.02 | 25.02 |
| EBITDA | 1.9 | 7.4 | 12.3 | 6.3 | 5.2 | 6.3 | 7.8 | 9.8 | 12.3 | 15.3 |
| EBITDA, % | 59.92 | 90.5 | 93.37 | 87.14 | 85.76 | 83.34 | 83.34 | 83.34 | 83.34 | 83.34 |
| Depreciation | .0 | .0 | .0 | .0 | .0 | .0 | .0 | .0 | .0 | .0 |
| Depreciation, % | 0 | 0 | 0 | 0 | 0 | 0 | 0 | 0 | 0 | 0 |
| EBIT | 1.9 | 7.4 | 12.3 | 6.3 | 5.2 | 6.3 | 7.8 | 9.8 | 12.3 | 15.3 |
| EBIT, % | 59.92 | 90.5 | 93.37 | 87.14 | 85.76 | 83.34 | 83.34 | 83.34 | 83.34 | 83.34 |
| Total Cash | 1.2 | 1.8 | 2.0 | 1.4 | 1.6 | 1.8 | 2.3 | 2.8 | 3.5 | 4.4 |
| Total Cash, percent | .0 | .0 | .0 | .0 | .0 | .0 | .0 | .0 | .0 | .0 |
| Account Receivables | .0 | .0 | .0 | .0 | .0 | .0 | .0 | .0 | .0 | .0 |
| Account Receivables, % | 0 | 0 | 0 | 0 | 0 | 0 | 0 | 0 | 0 | 0 |
| Inventories | .0 | .0 | .0 | .0 | .0 | .0 | .0 | .0 | .0 | .0 |
| Inventories, % | 0 | 0 | 0 | 0 | 0 | 0 | 0 | 0 | 0 | 0 |
| Accounts Payable | .0 | .0 | .0 | .0 | .0 | .0 | .0 | .0 | .0 | .0 |
| Accounts Payable, % | 0 | 0 | 0 | 0 | 0 | 0 | 0 | 0 | 0 | 0 |
| Capital Expenditure | .0 | .0 | .0 | .0 | .0 | .0 | .0 | .0 | .0 | .0 |
| Capital Expenditure, % | 0 | 0 | 0 | 0 | 0 | 0 | 0 | 0 | 0 | 0 |
| Tax Rate, % | 0 | 0 | 0 | 0 | 0 | 0 | 0 | 0 | 0 | 0 |
| EBITAT | 1.9 | 7.4 | 12.3 | 6.3 | 5.2 | 6.3 | 7.8 | 9.8 | 12.3 | 15.3 |
| Depreciation | ||||||||||
| Changes in Account Receivables | ||||||||||
| Changes in Inventories | ||||||||||
| Changes in Accounts Payable | ||||||||||
| Capital Expenditure | ||||||||||
| UFCF | 1.9 | 7.4 | 12.3 | 6.3 | 5.2 | 6.3 | 7.8 | 9.8 | 12.3 | 15.3 |
| WACC, % | 8.84 | 8.84 | 8.84 | 8.84 | 8.84 | 8.84 | 8.84 | 8.84 | 8.84 | 8.84 |
| PV UFCF | ||||||||||
| SUM PV UFCF | 38.7 | |||||||||
| Long Term Growth Rate, % | 2.00 | |||||||||
| Free cash flow (T + 1) | 16 | |||||||||
| Terminal Value | 228 | |||||||||
| Present Terminal Value | 149 | |||||||||
| Enterprise Value | 188 | |||||||||
| Net Debt | -2 | |||||||||
| Equity Value | 190 | |||||||||
| Diluted Shares Outstanding, MM | 12 | |||||||||
| Equity Value Per Share | 15.60 |
What You Will Get
- Editable Excel Template: A fully customizable Excel-based DCF Calculator featuring pre-filled real PRT financials.
- Real-World Data: Historical data and forward-looking estimates (as indicated in the yellow cells).
- Forecast Flexibility: Adjust forecast assumptions such as revenue growth, EBITDA %, and WACC.
- Automatic Calculations: Instantly observe the effect of your inputs on PermRock Royalty Trust's valuation.
- Professional Tool: Designed for investors, CFOs, consultants, and financial analysts.
- User-Friendly Design: Organized for clarity and ease of use, complete with step-by-step instructions.
Key Features
- Comprehensive Financial Data: Gain access to precise pre-loaded historical figures and future forecasts for PermRock Royalty Trust (PRT).
- Tailorable Forecast Parameters: Modify highlighted fields such as WACC, growth rates, and profit margins as needed.
- Real-Time Calculations: Automatic recalculations for DCF, Net Present Value (NPV), and cash flow assessments.
- Interactive Dashboard: User-friendly charts and summaries to effectively visualize your valuation findings.
- Designed for All Experience Levels: An intuitive layout crafted for investors, CFOs, and consultants alike.
How It Works
- Step 1: Download the prebuilt Excel template featuring PermRock Royalty Trust’s (PRT) data.
- Step 2: Navigate through the pre-filled sheets to familiarize yourself with the essential metrics.
- Step 3: Modify forecasts and assumptions in the editable yellow cells (WACC, growth, margins).
- Step 4: Instantly see the recalculated results, including PermRock Royalty Trust’s (PRT) intrinsic value.
- Step 5: Use the outputs to make informed investment decisions or to create reports.
Why Choose This Calculator for PermRock Royalty Trust (PRT)?
- Accurate Data: Up-to-date financials for PermRock ensure dependable valuation outcomes.
- Customizable: Tailor key metrics like production rates, royalty percentages, and discount rates to fit your forecasts.
- Time-Saving: Built-in calculations save you the hassle of starting from the ground up.
- Professional-Grade Tool: Crafted for investors, analysts, and financial advisors in the energy sector.
- User-Friendly: Simple interface and clear guidance make it accessible for all users.
Who Should Use This Product?
- Investors: Evaluate PermRock Royalty Trust’s (PRT) performance prior to making investment decisions.
- CFOs and Financial Analysts: Enhance valuation methodologies and analyze financial forecasts for PRT.
- Startup Founders: Understand the valuation practices of established entities like PermRock Royalty Trust (PRT).
- Consultants: Provide comprehensive valuation analyses and reports for clients interested in PRT.
- Students and Educators: Utilize data from PermRock Royalty Trust (PRT) to teach and apply valuation concepts.
What the Template Contains
- Pre-Filled Data: Contains PermRock Royalty Trust's historical financials and projections.
- Discounted Cash Flow Model: Editable DCF valuation model with automatic calculations.
- Weighted Average Cost of Capital (WACC): A dedicated sheet for calculating WACC based on custom inputs.
- Key Financial Ratios: Analyze PRT's profitability, efficiency, and leverage.
- Customizable Inputs: Easily modify revenue growth, margins, and tax rates.
- Clear Dashboard: Charts and tables summarizing key valuation results.
Disclaimer
All information, articles, and product details provided on this website are for general informational and educational purposes only. We do not claim any ownership over, nor do we intend to infringe upon, any trademarks, copyrights, logos, brand names, or other intellectual property mentioned or depicted on this site. Such intellectual property remains the property of its respective owners, and any references here are made solely for identification or informational purposes, without implying any affiliation, endorsement, or partnership.
We make no representations or warranties, express or implied, regarding the accuracy, completeness, or suitability of any content or products presented. Nothing on this website should be construed as legal, tax, investment, financial, medical, or other professional advice. In addition, no part of this site—including articles or product references—constitutes a solicitation, recommendation, endorsement, advertisement, or offer to buy or sell any securities, franchises, or other financial instruments, particularly in jurisdictions where such activity would be unlawful.
All content is of a general nature and may not address the specific circumstances of any individual or entity. It is not a substitute for professional advice or services. Any actions you take based on the information provided here are strictly at your own risk. You accept full responsibility for any decisions or outcomes arising from your use of this website and agree to release us from any liability in connection with your use of, or reliance upon, the content or products found herein.