
|
Punjab & Sind Bank (PSB.NS) DCF Valuation |
Fully Editable: Tailor To Your Needs In Excel Or Sheets
Professional Design: Trusted, Industry-Standard Templates
Investor-Approved Valuation Models
MAC/PC Compatible, Fully Unlocked
No Expertise Is Needed; Easy To Follow
Punjab & Sind Bank (PSB.NS) Bundle
Evaluate the financial outlook of Punjab & Sind Bank (PSBNS) like an expert! This (PSBNS) DCF Calculator comes with pre-filled financial data and offers full flexibility to modify revenue growth, WACC, margins, and other essential assumptions to align with your projections.
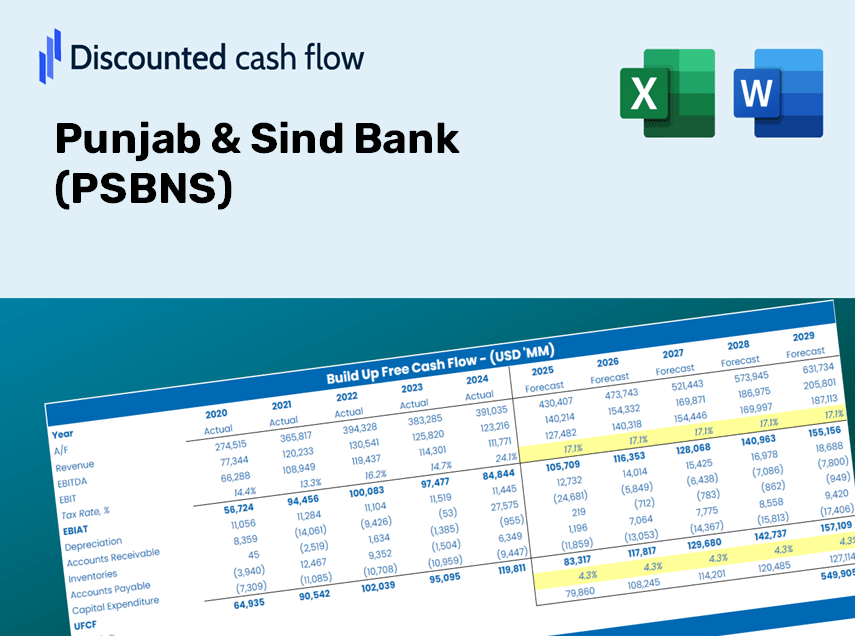
Discounted Cash Flow (DCF) - (USD MM)
| Year | AY1 2021 |
AY2 2022 |
AY3 2023 |
AY4 2024 |
AY5 2025 |
FY1 2026 |
FY2 2027 |
FY3 2028 |
FY4 2029 |
FY5 2030 |
|---|---|---|---|---|---|---|---|---|---|---|
| Revenue | -3,394.0 | 81,072.1 | 89,054.1 | 35,269.9 | 130,489.5 | 113,999.1 | 99,592.7 | 87,006.8 | 76,011.4 | 66,405.6 |
| Revenue Growth, % | 0 | -2488.66 | 9.85 | -60.39 | 269.97 | -12.64 | -12.64 | -12.64 | -12.64 | -12.64 |
| EBITDA | -33,021.1 | 13,237.8 | 17,681.8 | 10,870.6 | 14,826.4 | 40,667.3 | 35,528.1 | 31,038.3 | 27,115.8 | 23,689.1 |
| EBITDA, % | 972.91 | 16.33 | 19.86 | 30.82 | 11.36 | 35.67 | 35.67 | 35.67 | 35.67 | 35.67 |
| Depreciation | 1,021.3 | 1,370.9 | 1,483.3 | 1,500.8 | 1,450.8 | -4,871.9 | -4,256.3 | -3,718.4 | -3,248.5 | -2,838.0 |
| Depreciation, % | -30.09 | 1.69 | 1.67 | 4.26 | 1.11 | -4.27 | -4.27 | -4.27 | -4.27 | -4.27 |
| EBIT | -34,042.4 | 11,866.8 | 16,198.5 | 9,369.8 | 13,375.5 | 38,678.3 | 33,790.4 | 29,520.2 | 25,789.7 | 22,530.5 |
| EBIT, % | 1003.01 | 14.64 | 18.19 | 26.57 | 10.25 | 33.93 | 33.93 | 33.93 | 33.93 | 33.93 |
| Total Cash | 116,575.0 | 90,474.5 | 62,967.2 | 73,830.1 | 101,887.0 | 56,723.1 | 49,554.8 | 43,292.4 | 37,821.4 | 33,041.8 |
| Total Cash, percent | .0 | .0 | .0 | .0 | .0 | .0 | .0 | .0 | .0 | .0 |
| Account Receivables | 9,787.2 | 12,359.2 | 16,528.2 | 18,360.9 | 29,979.9 | 2,014.9 | 1,760.3 | 1,537.9 | 1,343.5 | 1,173.7 |
| Account Receivables, % | -288.36 | 15.24 | 18.56 | 52.06 | 22.97 | 1.77 | 1.77 | 1.77 | 1.77 | 1.77 |
| Inventories | .0 | -86,063.3 | -75,143.7 | -92,191.0 | .0 | -64,838.1 | -56,644.3 | -49,486.0 | -43,232.3 | -37,768.8 |
| Inventories, % | 0 | -106.16 | -84.38 | -261.39 | 0 | -56.88 | -56.88 | -56.88 | -56.88 | -56.88 |
| Accounts Payable | 7,362.2 | 6,876.6 | 8,113.9 | 10,317.1 | 11,668.7 | -10,080.4 | -8,806.5 | -7,693.6 | -6,721.4 | -5,872.0 |
| Accounts Payable, % | -216.92 | 8.48 | 9.11 | 29.25 | 8.94 | -8.84 | -8.84 | -8.84 | -8.84 | -8.84 |
| Capital Expenditure | -4,462.3 | -1,207.9 | -90,312.5 | -2,290.7 | -1,676.1 | -24,913.2 | -21,764.8 | -19,014.3 | -16,611.4 | -14,512.2 |
| Capital Expenditure, % | 131.47 | -1.49 | -101.41 | -6.49 | -1.28 | -21.85 | -21.85 | -21.85 | -21.85 | -21.85 |
| Tax Rate, % | 24.05 | 24.05 | 24.05 | 24.05 | 24.05 | 24.05 | 24.05 | 24.05 | 24.05 | 24.05 |
| EBITAT | -27,328.9 | 10,390.6 | 13,130.3 | 5,954.2 | 10,158.3 | 30,044.7 | 26,247.9 | 22,930.8 | 20,033.0 | 17,501.3 |
| Depreciation | ||||||||||
| Changes in Account Receivables | ||||||||||
| Changes in Inventories | ||||||||||
| Changes in Accounts Payable | ||||||||||
| Capital Expenditure | ||||||||||
| UFCF | -33,194.9 | 93,559.2 | -89,550.1 | 22,582.0 | -92,525.3 | 71,313.5 | -6,438.5 | -5,624.8 | -4,914.0 | -4,293.0 |
| WACC, % | 22.13 | 23.85 | 22.32 | 18.19 | 21.11 | 21.52 | 21.52 | 21.52 | 21.52 | 21.52 |
| PV UFCF | ||||||||||
| SUM PV UFCF | 47,316.6 | |||||||||
| Long Term Growth Rate, % | 2.00 | |||||||||
| Free cash flow (T + 1) | -4,379 | |||||||||
| Terminal Value | -22,432 | |||||||||
| Present Terminal Value | -8,465 | |||||||||
| Enterprise Value | 38,851 | |||||||||
| Net Debt | 16,908 | |||||||||
| Equity Value | 21,943 | |||||||||
| Diluted Shares Outstanding, MM | 6,713 | |||||||||
| Equity Value Per Share | 3.27 |
What You Will Receive
- Authentic Punjab & Sind Bank Data: Comprehensive financials – from revenue to EBIT – based on actual and forecasted figures.
- Comprehensive Customization: Modify all essential parameters (yellow cells) such as WACC, growth %, and tax rates.
- Immediate Valuation Adjustments: Automatic recalculations to assess the effects of changes on the fair value of Punjab & Sind Bank (PSBNS).
- Flexible Excel Template: Designed for easy modifications, scenario analyses, and detailed forecasting.
- Efficient and Precise: Eliminate the need to build models from the ground up while ensuring accuracy and adaptability.
Key Features
- Pre-Loaded Data: Access Punjab & Sind Bank’s (PSBNS) historical financial statements and pre-filled forecasts.
- Fully Adjustable Inputs: Customize WACC, tax rates, revenue growth, and EBITDA margins to fit your analysis.
- Instant Results: View the intrinsic value of Punjab & Sind Bank (PSBNS) recalculated in real time.
- Clear Visual Outputs: Interactive dashboard charts illustrate valuation results and essential metrics.
- Built for Accuracy: A robust tool designed for analysts, investors, and finance professionals.
How It Works
- Step 1: Download the Excel file.
- Step 2: Examine the pre-filled data for Punjab & Sind Bank (PSBNS) including historical performance and forecasts.
- Step 3: Modify key assumptions (highlighted in yellow) based on your findings.
- Step 4: Observe the automatic updates for Punjab & Sind Bank’s (PSBNS) intrinsic value.
- Step 5: Utilize the results to inform your investment choices or reporting needs.
Why Select Punjab & Sind Bank (PSBNS)?
- User-Friendly Interface: Crafted for both novices and seasoned professionals.
- Customizable Parameters: Adjust inputs easily to suit your financial analysis needs.
- Real-Time Updates: Observe immediate changes in Punjab & Sind Bank's (PSBNS) valuation as you modify the inputs.
- Pre-Configured Data: Comes with Punjab & Sind Bank’s (PSBNS) actual financial information for swift evaluations.
- Relied Upon by Experts: Favored by investors and analysts for making well-informed decisions.
Who Can Benefit from This Product?
- Investors: Assess Punjab & Sind Bank’s (PSBNS) valuation prior to making investment decisions.
- CFOs and Financial Analysts: Optimize valuation methodologies and validate financial forecasts.
- Startup Founders: Understand the valuation practices of established banks like Punjab & Sind Bank (PSBNS).
- Consultants: Create comprehensive valuation reports for your clients regarding Punjab & Sind Bank (PSBNS).
- Students and Educators: Utilize real market data to enhance learning and application of valuation methods.
Features of the Template
- Comprehensive DCF Model: Editable template featuring detailed valuation computations.
- Real-World Data: Punjab & Sind Bank’s (PSBNS) historical and projected financials preloaded for thorough analysis.
- Customizable Parameters: Modify WACC, growth rates, and tax assumptions to explore various scenarios.
- Financial Statements: Complete annual and quarterly breakdowns for enhanced insights.
- Key Ratios: Integrated analysis for evaluating profitability, efficiency, and leverage.
- Dashboard with Visual Outputs: Charts and tables providing clear, actionable results.
Disclaimer
All information, articles, and product details provided on this website are for general informational and educational purposes only. We do not claim any ownership over, nor do we intend to infringe upon, any trademarks, copyrights, logos, brand names, or other intellectual property mentioned or depicted on this site. Such intellectual property remains the property of its respective owners, and any references here are made solely for identification or informational purposes, without implying any affiliation, endorsement, or partnership.
We make no representations or warranties, express or implied, regarding the accuracy, completeness, or suitability of any content or products presented. Nothing on this website should be construed as legal, tax, investment, financial, medical, or other professional advice. In addition, no part of this site—including articles or product references—constitutes a solicitation, recommendation, endorsement, advertisement, or offer to buy or sell any securities, franchises, or other financial instruments, particularly in jurisdictions where such activity would be unlawful.
All content is of a general nature and may not address the specific circumstances of any individual or entity. It is not a substitute for professional advice or services. Any actions you take based on the information provided here are strictly at your own risk. You accept full responsibility for any decisions or outcomes arising from your use of this website and agree to release us from any liability in connection with your use of, or reliance upon, the content or products found herein.