
|
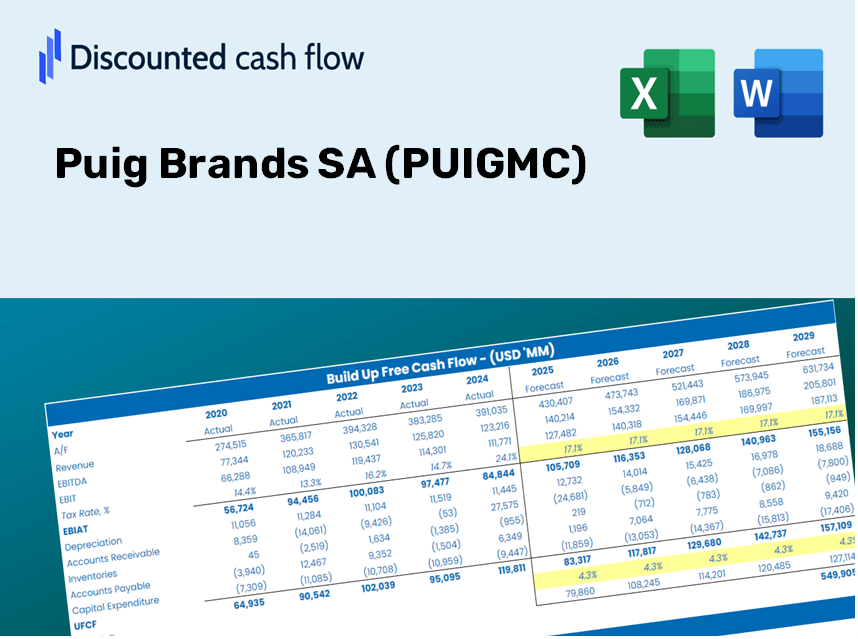
Puig Brands SA (PUIG.MC) DCF Valuation |
Fully Editable: Tailor To Your Needs In Excel Or Sheets
Professional Design: Trusted, Industry-Standard Templates
Investor-Approved Valuation Models
MAC/PC Compatible, Fully Unlocked
No Expertise Is Needed; Easy To Follow
Puig Brands SA (PUIG.MC) Bundle
Discover the true value of Puig Brands SA (PUIGMC) with our professional-grade DCF Calculator! Adjust key assumptions, explore various scenarios, and evaluate how changes affect Puig Brands SA (PUIGMC) valuation – all within a single Excel template.
What You Will Receive
- Authentic PUIG Financial Data: Pre-loaded with Puig Brands SA's historical and forecasted figures for in-depth analysis.
- Completely Customizable Template: Easily adjust key metrics like revenue growth, WACC, and EBITDA percentage.
- Instant Calculations: Watch the intrinsic value of Puig Brands SA update in real-time as you make adjustments.
- Expert Valuation Tool: Tailored for investors, analysts, and consultants seeking reliable DCF outputs.
- Intuitive User Interface: Clear layout and straightforward guidance suitable for all skill levels.
Key Features
- 🔍 Real-Life PUIGMC Financials: Pre-filled historical and projected data for Puig Brands SA.
- ✏️ Fully Customizable Inputs: Modify all essential parameters (yellow cells) such as WACC, growth %, and tax rates.
- 📊 Professional DCF Valuation: Integrated formulas to determine Puig’s intrinsic value using the Discounted Cash Flow method.
- ⚡ Instant Results: Visualize Puig’s valuation immediately after making adjustments.
- Scenario Analysis: Evaluate and compare the results for different financial assumptions side-by-side.
How It Works
- Step 1: Download the prebuilt Excel template containing Puig Brands SA's data.
- Step 2: Navigate through the pre-filled sheets to familiarize yourself with the key metrics.
- Step 3: Adjust forecasts and assumptions in the editable yellow cells (WACC, growth, margins).
- Step 4: Instantly view the recalculated results, including Puig Brands SA's intrinsic value.
- Step 5: Utilize the outputs to make informed investment decisions or create detailed reports.
Why Opt for This Calculator?
- Precision: Authentic Puig financials guarantee precise data.
- Versatility: Engineered for users to experiment with and adjust inputs at will.
- Efficiency: Eliminate the need to construct a DCF model from the ground up.
- Professional Quality: Crafted with the accuracy and usability expected by CFOs.
- Intuitive Design: Simple to navigate, even for those lacking advanced financial modeling skills.
Who Should Utilize This Product?
- Investors: Accurately assess the fair value of Puig Brands SA (PUIGMC) prior to making investment choices.
- CFOs: Utilize a high-caliber DCF model for comprehensive financial reporting and analysis.
- Consultants: Efficiently modify the template to create valuation reports tailored for clients.
- Entrepreneurs: Acquire valuable insights into the financial modeling practices of leading companies.
- Educators: Employ this resource as a teaching aid to illustrate various valuation techniques.
Contents of the Template
- Comprehensive DCF Model: Fully editable template featuring extensive valuation calculations.
- Real-World Data: Puig Brands SA's (PUIGMC) historical and projected financial information preloaded for in-depth analysis.
- Customizable Parameters: Modify WACC, growth rates, and tax assumptions to explore various scenarios.
- Financial Statements: Detailed annual and quarterly breakdowns for enhanced insights.
- Key Ratios: Integrated analysis covering profitability, efficiency, and leverage metrics.
- Dashboard with Visual Outputs: Visualizations such as charts and tables for clear and actionable results.
Disclaimer
All information, articles, and product details provided on this website are for general informational and educational purposes only. We do not claim any ownership over, nor do we intend to infringe upon, any trademarks, copyrights, logos, brand names, or other intellectual property mentioned or depicted on this site. Such intellectual property remains the property of its respective owners, and any references here are made solely for identification or informational purposes, without implying any affiliation, endorsement, or partnership.
We make no representations or warranties, express or implied, regarding the accuracy, completeness, or suitability of any content or products presented. Nothing on this website should be construed as legal, tax, investment, financial, medical, or other professional advice. In addition, no part of this site—including articles or product references—constitutes a solicitation, recommendation, endorsement, advertisement, or offer to buy or sell any securities, franchises, or other financial instruments, particularly in jurisdictions where such activity would be unlawful.
All content is of a general nature and may not address the specific circumstances of any individual or entity. It is not a substitute for professional advice or services. Any actions you take based on the information provided here are strictly at your own risk. You accept full responsibility for any decisions or outcomes arising from your use of this website and agree to release us from any liability in connection with your use of, or reliance upon, the content or products found herein.