
|
PVR INOX Limited (PVRINOX.NS) DCF Valuation |
Fully Editable: Tailor To Your Needs In Excel Or Sheets
Professional Design: Trusted, Industry-Standard Templates
Investor-Approved Valuation Models
MAC/PC Compatible, Fully Unlocked
No Expertise Is Needed; Easy To Follow
PVR INOX Limited (PVRINOX.NS) Bundle
Discover the true potential of PVR INOX Limited with our advanced DCF Calculator! Adjust key assumptions, explore various scenarios, and evaluate how changes affect PVR INOX Limited's valuation – all within a single Excel template.
Discounted Cash Flow (DCF) - (USD MM)
| Year | AY1 2021 |
AY2 2022 |
AY3 2023 |
AY4 2024 |
AY5 2025 |
FY1 2026 |
FY2 2027 |
FY3 2028 |
FY4 2029 |
FY5 2030 |
|---|---|---|---|---|---|---|---|---|---|---|
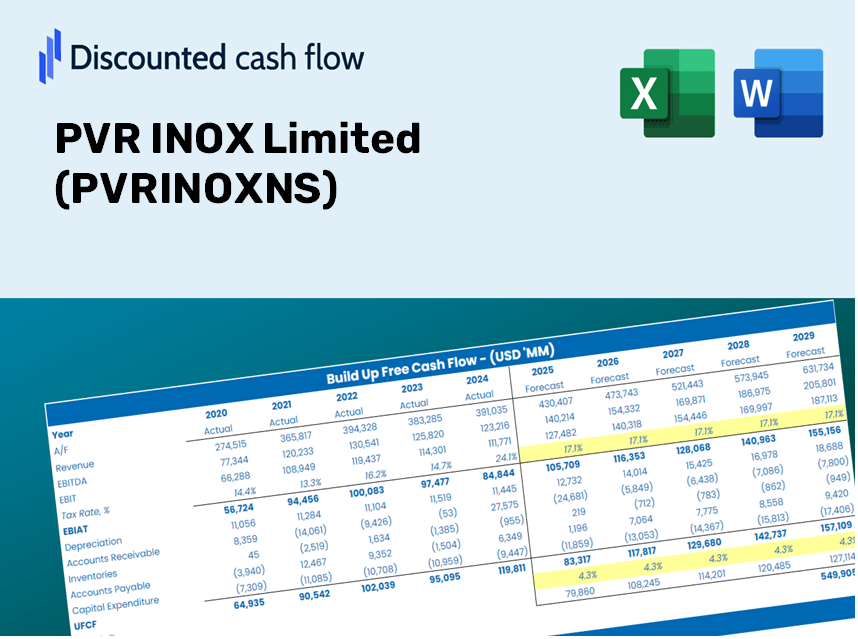
| Revenue | 2,800.1 | 13,294.0 | 37,506.0 | 61,071.0 | 57,799.0 | 95,003.1 | 156,154.7 | 256,668.5 | 421,881.1 | 693,437.8 |
| Revenue Growth, % | 0 | 374.77 | 182.13 | 62.83 | -5.36 | 64.37 | 64.37 | 64.37 | 64.37 | 64.37 |
| EBITDA | -6,755.0 | -2,583.5 | 5,837.0 | 10,312.0 | 7,175.0 | -14,169.1 | -23,289.5 | -38,280.4 | -62,920.8 | -103,421.8 |
| EBITDA, % | -241.24 | -19.43 | 15.56 | 16.89 | 12.41 | -14.91 | -14.91 | -14.91 | -14.91 | -14.91 |
| Depreciation | 2,203.3 | 2,304.0 | 2,765.0 | 4,129.0 | 4,314.0 | 22,347.5 | 36,732.1 | 60,375.9 | 99,238.7 | 163,116.7 |
| Depreciation, % | 78.69 | 17.33 | 7.37 | 6.76 | 7.46 | 23.52 | 23.52 | 23.52 | 23.52 | 23.52 |
| EBIT | -8,958.3 | -4,887.5 | 3,072.0 | 6,183.0 | 2,861.0 | -21,565.7 | -35,447.1 | -58,263.7 | -95,766.9 | -157,410.1 |
| EBIT, % | -319.93 | -36.76 | 8.19 | 10.12 | 4.95 | -22.7 | -22.7 | -22.7 | -22.7 | -22.7 |
| Total Cash | 7,149.0 | 5,604.8 | 3,616.0 | 4,224.0 | 5,289.0 | 31,896.1 | 52,427.0 | 86,173.2 | 141,641.3 | 232,813.0 |
| Total Cash, percent | .0 | .0 | .0 | .0 | .0 | .0 | .0 | .0 | .0 | .0 |
| Account Receivables | 1,474.6 | 1,296.8 | 3,112.0 | 2,625.0 | 2,445.0 | 15,056.7 | 24,748.3 | 40,678.4 | 66,862.2 | 109,900.1 |
| Account Receivables, % | 52.66 | 9.75 | 8.3 | 4.3 | 4.23 | 15.85 | 15.85 | 15.85 | 15.85 | 15.85 |
| Inventories | 249.5 | 342.0 | 663.7 | 725.0 | 802.0 | 3,007.3 | 4,943.0 | 8,124.7 | 13,354.5 | 21,950.5 |
| Inventories, % | 8.91 | 2.57 | 1.77 | 1.19 | 1.39 | 3.17 | 3.17 | 3.17 | 3.17 | 3.17 |
| Accounts Payable | 2,031.6 | 3,001.4 | 5,143.0 | 6,511.0 | 7,523.0 | 25,179.9 | 41,387.7 | 68,028.1 | 111,816.4 | 183,790.5 |
| Accounts Payable, % | 72.55 | 22.58 | 13.71 | 10.66 | 13.02 | 26.5 | 26.5 | 26.5 | 26.5 | 26.5 |
| Capital Expenditure | -1,167.4 | -1,249.0 | -6,359.5 | -6,344.0 | -3,335.0 | -15,998.6 | -26,296.6 | -43,223.2 | -71,045.2 | -116,775.5 |
| Capital Expenditure, % | -41.69 | -9.4 | -16.96 | -10.39 | -5.77 | -16.84 | -16.84 | -16.84 | -16.84 | -16.84 |
| Tax Rate, % | 25.3 | 25.3 | 25.3 | 25.3 | 25.3 | 25.3 | 25.3 | 25.3 | 25.3 | 25.3 |
| EBITAT | -7,135.3 | -3,505.6 | 4,925.5 | 4,507.0 | 2,137.2 | -17,208.0 | -28,284.5 | -46,490.7 | -76,415.8 | -125,603.2 |
| Depreciation | ||||||||||
| Changes in Account Receivables | ||||||||||
| Changes in Inventories | ||||||||||
| Changes in Accounts Payable | ||||||||||
| Capital Expenditure | ||||||||||
| UFCF | -5,791.9 | -1,395.5 | 1,335.7 | 4,085.7 | 4,231.2 | -8,019.2 | -13,268.6 | -21,809.3 | -35,847.5 | -58,921.8 |
| WACC, % | 6.37 | 6.02 | 7.25 | 6.07 | 6.15 | 6.37 | 6.37 | 6.37 | 6.37 | 6.37 |
| PV UFCF | ||||||||||
| SUM PV UFCF | -108,652.6 | |||||||||
| Long Term Growth Rate, % | 4.00 | |||||||||
| Free cash flow (T + 1) | -61,279 | |||||||||
| Terminal Value | -2,584,095 | |||||||||
| Present Terminal Value | -1,897,512 | |||||||||
| Enterprise Value | -2,006,164 | |||||||||
| Net Debt | 72,457 | |||||||||
| Equity Value | -2,078,621 | |||||||||
| Diluted Shares Outstanding, MM | 98 | |||||||||
| Equity Value Per Share | -21,172.83 |
What You'll Receive
- Flexible Forecast Inputs: Modify key assumptions (growth %, margins, WACC) effortlessly to develop various scenarios.
- Relevant Data at Your Fingertips: PVR INOX Limited's financial information pre-loaded to enhance your analysis.
- Automated DCF Calculations: The template computes Net Present Value (NPV) and intrinsic value automatically.
- Customizable and Professional Design: A sleek Excel model tailored to fit your valuation requirements.
- Designed for Analysts and Investors: Perfect for evaluating projections, confirming strategies, and optimizing your time.
Key Features
- Comprehensive Financial Insight: Gain access to accurate pre-loaded historical data and future forecasts for PVR INOX Limited (PVRINOXNS).
- Tailorable Forecast Parameters: Modify highlighted yellow cells for WACC, growth rates, and profit margins.
- Automated Calculations: Enjoy real-time updates to DCF, Net Present Value (NPV), and cash flow analyses.
- User-Friendly Dashboard: Easily interpret charts and summaries to enhance your valuation insights.
- Designed for All Levels: An intuitive framework suitable for investors, CFOs, and consultants alike.
How It Works
- Step 1: Download the Excel file for PVR INOX Limited (PVRINOXNS).
- Step 2: Review the pre-filled financial data and forecasts specific to PVR INOX Limited.
- Step 3: Adjust key inputs such as revenue growth, WACC, and tax rates (highlighted cells) as needed.
- Step 4: Observe the DCF model update in real-time as you modify the assumptions.
- Step 5: Analyze the results and leverage the findings for informed investment decisions.
Why Choose This Calculator for PVR INOX Limited (PVRINOXNS)?
- Accurate Data: Access to authentic PVR INOX financials ensures trustworthy valuation outcomes.
- Customizable: Tailor essential variables such as growth rates, WACC, and tax rates to align with your forecasts.
- Time-Saving: Ready-made calculations help you avoid starting from square one.
- Professional-Grade Tool: Engineered for investors, analysts, and consultants in the industry.
- User-Friendly: An intuitive design with clear, step-by-step guidance makes it accessible for all users.
Who Can Benefit from PVR INOX Limited (PVRINOXNS)?
- Investors: Make informed investment choices with a reliable valuation tool tailored for cinema and entertainment sectors.
- Financial Analysts: Enhance efficiency with a customizable model designed for analyzing entertainment industry valuations.
- Consultants: Effortlessly modify templates for presentations or reports tailored to clients in the cinema space.
- Entertainment Enthusiasts: Expand your knowledge of valuation methodologies through industry-specific case studies.
- Educators and Students: Utilize it as a hands-on resource for finance courses focused on the entertainment sector.
Contents of the Template
- Pre-Filled DCF Model: PVR INOX Limited’s financial data preloaded for immediate application.
- WACC Calculator: Comprehensive calculations for the Weighted Average Cost of Capital.
- Financial Ratios: Assess PVR INOX Limited’s profitability, leverage, and operational efficiency.
- Editable Inputs: Customize assumptions such as growth rates, margins, and CAPEX for your specific scenarios.
- Financial Statements: Access annual and quarterly reports for in-depth analysis.
- Interactive Dashboard: Visualize essential valuation metrics and outcomes with ease.
Disclaimer
All information, articles, and product details provided on this website are for general informational and educational purposes only. We do not claim any ownership over, nor do we intend to infringe upon, any trademarks, copyrights, logos, brand names, or other intellectual property mentioned or depicted on this site. Such intellectual property remains the property of its respective owners, and any references here are made solely for identification or informational purposes, without implying any affiliation, endorsement, or partnership.
We make no representations or warranties, express or implied, regarding the accuracy, completeness, or suitability of any content or products presented. Nothing on this website should be construed as legal, tax, investment, financial, medical, or other professional advice. In addition, no part of this site—including articles or product references—constitutes a solicitation, recommendation, endorsement, advertisement, or offer to buy or sell any securities, franchises, or other financial instruments, particularly in jurisdictions where such activity would be unlawful.
All content is of a general nature and may not address the specific circumstances of any individual or entity. It is not a substitute for professional advice or services. Any actions you take based on the information provided here are strictly at your own risk. You accept full responsibility for any decisions or outcomes arising from your use of this website and agree to release us from any liability in connection with your use of, or reliance upon, the content or products found herein.