
|
Pixelworks, Inc. (PXLW) DCF Valuation |
Fully Editable: Tailor To Your Needs In Excel Or Sheets
Professional Design: Trusted, Industry-Standard Templates
Investor-Approved Valuation Models
MAC/PC Compatible, Fully Unlocked
No Expertise Is Needed; Easy To Follow
Pixelworks, Inc. (PXLW) Bundle
Explore the financial future of Pixelworks, Inc. (PXLW) with our user-friendly DCF Calculator! Enter your assumptions for growth, margins, and costs to calculate the intrinsic value of Pixelworks, Inc. (PXLW) and refine your investment strategy.
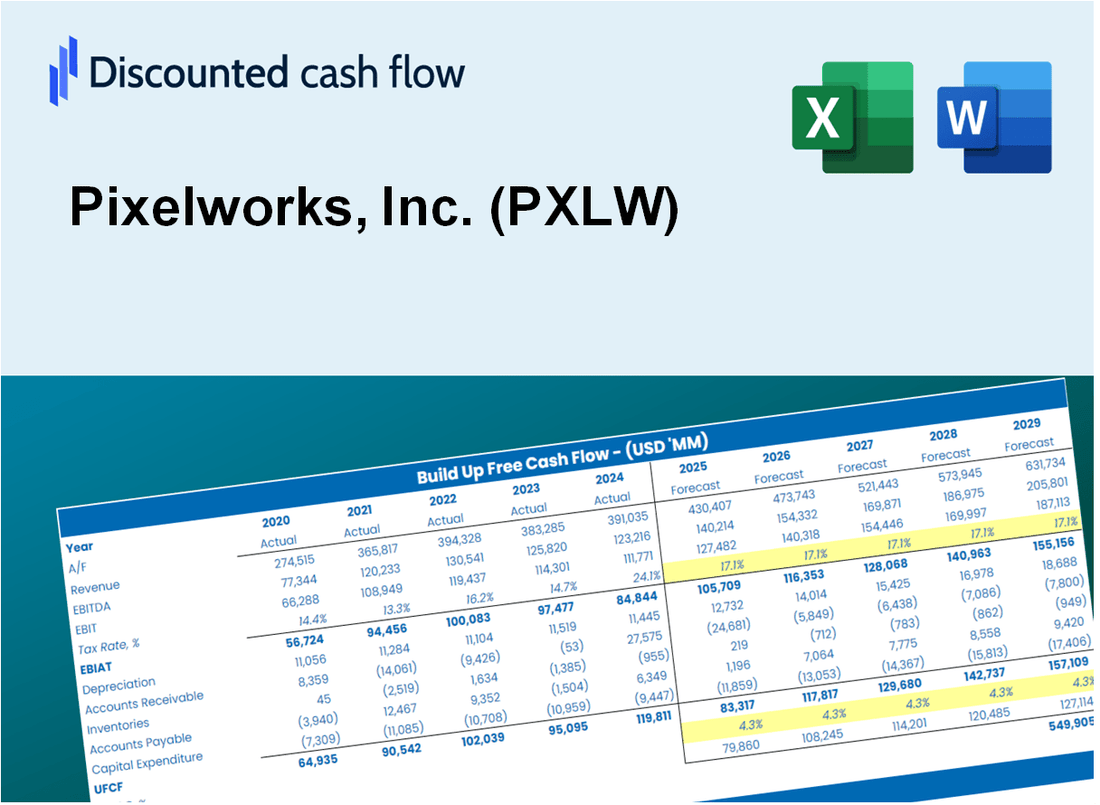
Discounted Cash Flow (DCF) - (USD MM)
| Year | AY1 2020 |
AY2 2021 |
AY3 2022 |
AY4 2023 |
AY5 2024 |
FY1 2025 |
FY2 2026 |
FY3 2027 |
FY4 2028 |
FY5 2029 |
|---|---|---|---|---|---|---|---|---|---|---|
| Revenue | 40.9 | 55.1 | 70.1 | 59.7 | 43.2 | 45.3 | 47.6 | 49.9 | 52.3 | 54.9 |
| Revenue Growth, % | 0 | 34.87 | 27.3 | -14.92 | -27.6 | 4.91 | 4.91 | 4.91 | 4.91 | 4.91 |
| EBITDA | -20.5 | -16.5 | -13.6 | -22.3 | -25.2 | -17.7 | -18.5 | -19.5 | -20.4 | -21.4 |
| EBITDA, % | -50.08 | -29.85 | -19.35 | -37.32 | -58.35 | -38.99 | -38.99 | -38.99 | -38.99 | -38.99 |
| Depreciation | 5.2 | 3.6 | 3.2 | 4.3 | 3.8 | 3.6 | 3.8 | 4.0 | 4.2 | 4.4 |
| Depreciation, % | 12.81 | 6.45 | 4.62 | 7.19 | 8.75 | 7.96 | 7.96 | 7.96 | 7.96 | 7.96 |
| EBIT | -25.7 | -20.0 | -16.8 | -26.6 | -29.0 | -21.3 | -22.3 | -23.4 | -24.6 | -25.8 |
| EBIT, % | -62.89 | -36.3 | -23.97 | -44.51 | -67.1 | -46.95 | -46.95 | -46.95 | -46.95 | -46.95 |
| Total Cash | 31.5 | 61.6 | 56.8 | 47.5 | 23.6 | 35.6 | 37.3 | 39.2 | 41.1 | 43.1 |
| Total Cash, percent | .0 | .0 | .0 | .0 | .0 | .0 | .0 | .0 | .0 | .0 |
| Account Receivables | 4.7 | 8.7 | 10.0 | 10.1 | 5.8 | 6.5 | 6.8 | 7.2 | 7.5 | 7.9 |
| Account Receivables, % | 11.44 | 15.8 | 14.32 | 16.88 | 13.43 | 14.38 | 14.38 | 14.38 | 14.38 | 14.38 |
| Inventories | 2.4 | 1.5 | 1.8 | 4.0 | 4.2 | 2.5 | 2.6 | 2.7 | 2.9 | 3.0 |
| Inventories, % | 5.98 | 2.67 | 2.51 | 6.65 | 9.74 | 5.51 | 5.51 | 5.51 | 5.51 | 5.51 |
| Accounts Payable | 1.0 | 2.7 | 3.1 | 2.4 | 1.4 | 1.7 | 1.8 | 1.9 | 2.0 | 2.1 |
| Accounts Payable, % | 2.44 | 4.99 | 4.48 | 4.05 | 3.24 | 3.84 | 3.84 | 3.84 | 3.84 | 3.84 |
| Capital Expenditure | -2.8 | -3.5 | -3.0 | -3.8 | -3.8 | -3.0 | -3.1 | -3.2 | -3.4 | -3.6 |
| Capital Expenditure, % | -6.83 | -6.31 | -4.29 | -6.42 | -8.7 | -6.51 | -6.51 | -6.51 | -6.51 | -6.51 |
| Tax Rate, % | 1.17 | 1.17 | 1.17 | 1.17 | 1.17 | 1.17 | 1.17 | 1.17 | 1.17 | 1.17 |
| EBITAT | -26.3 | -20.3 | -16.7 | -26.2 | -28.7 | -21.1 | -22.2 | -23.3 | -24.4 | -25.6 |
| Depreciation | ||||||||||
| Changes in Account Receivables | ||||||||||
| Changes in Inventories | ||||||||||
| Changes in Accounts Payable | ||||||||||
| Capital Expenditure | ||||||||||
| UFCF | -30.0 | -21.5 | -17.7 | -28.7 | -25.6 | -19.1 | -21.8 | -22.9 | -24.0 | -25.2 |
| WACC, % | 10.45 | 10.45 | 10.45 | 10.45 | 10.45 | 10.45 | 10.45 | 10.45 | 10.45 | 10.45 |
| PV UFCF | ||||||||||
| SUM PV UFCF | -83.8 | |||||||||
| Long Term Growth Rate, % | 2.00 | |||||||||
| Free cash flow (T + 1) | -26 | |||||||||
| Terminal Value | -305 | |||||||||
| Present Terminal Value | -185 | |||||||||
| Enterprise Value | -269 | |||||||||
| Net Debt | -20 | |||||||||
| Equity Value | -249 | |||||||||
| Diluted Shares Outstanding, MM | 5 | |||||||||
| Equity Value Per Share | -51.16 |
What You Will Get
- Pre-Filled Financial Model: Pixelworks, Inc.'s (PXLW) actual data enables precise DCF valuation.
- Full Forecast Control: Adjust revenue growth, margins, WACC, and other key drivers.
- Instant Calculations: Automatic updates ensure you see results as you make changes.
- Investor-Ready Template: A refined Excel file designed for professional-grade valuation.
- Customizable and Reusable: Tailored for flexibility, allowing repeated use for detailed forecasts.
Key Features
- Advanced DCF Calculator: Features comprehensive unlevered and levered DCF valuation models tailored for Pixelworks, Inc. (PXLW).
- WACC Calculator: A pre-designed Weighted Average Cost of Capital sheet with customizable variables specific to Pixelworks, Inc. (PXLW).
- Editable Forecast Assumptions: Adjust growth rates, capital expenditures, and discount rates to fit Pixelworks, Inc. (PXLW) projections.
- Built-In Financial Ratios: Evaluate profitability, leverage, and efficiency ratios pertinent to Pixelworks, Inc. (PXLW).
- Dashboard and Charts: Visual representations that summarize key valuation metrics for straightforward analysis of Pixelworks, Inc. (PXLW).
How It Works
- Step 1: Download the prebuilt Excel template with Pixelworks, Inc. (PXLW) data included.
- Step 2: Explore the pre-filled sheets and familiarize yourself with the key metrics.
- Step 3: Update forecasts and assumptions in the editable yellow cells (WACC, growth, margins).
- Step 4: Instantly view recalculated results, including Pixelworks, Inc. (PXLW)'s intrinsic value.
- Step 5: Make informed investment decisions or generate reports using the outputs.
Why Choose Pixelworks, Inc. (PXLW)?
- Innovative Technology: Leverage cutting-edge solutions for superior visual experiences.
- Proven Performance: Our products consistently deliver high-quality results in various applications.
- Customer-Centric Approach: We prioritize your needs, ensuring tailored solutions for your projects.
- Expert Support: Our dedicated team is ready to assist you with any technical challenges.
- Industry Recognition: Trusted by leading companies for excellence in video and display technologies.
Who Should Use This Product?
- Professional Investors: Develop comprehensive and trustworthy valuation models for assessing Pixelworks, Inc. (PXLW) within their portfolios.
- Corporate Finance Teams: Evaluate valuation scenarios to inform strategic decisions for Pixelworks, Inc. (PXLW).
- Consultants and Advisors: Deliver precise valuation insights regarding Pixelworks, Inc. (PXLW) to clients.
- Students and Educators: Utilize real-time data to enhance learning and practice in financial modeling related to Pixelworks, Inc. (PXLW).
- Tech Enthusiasts: Gain insights into how companies like Pixelworks, Inc. (PXLW) are assessed in the tech market.
What the Template Contains
- Pre-Filled Data: Includes Pixelworks, Inc.'s (PXLW) historical financials and projections.
- Discounted Cash Flow Model: Editable DCF valuation model with automated calculations.
- Weighted Average Cost of Capital (WACC): A dedicated sheet for calculating WACC based on user-defined inputs.
- Key Financial Ratios: Evaluate Pixelworks, Inc.'s (PXLW) profitability, efficiency, and leverage.
- Customizable Inputs: Easily modify revenue growth, profit margins, and tax rates.
- Clear Dashboard: Visual representations including charts and tables summarizing key valuation outcomes.
Disclaimer
All information, articles, and product details provided on this website are for general informational and educational purposes only. We do not claim any ownership over, nor do we intend to infringe upon, any trademarks, copyrights, logos, brand names, or other intellectual property mentioned or depicted on this site. Such intellectual property remains the property of its respective owners, and any references here are made solely for identification or informational purposes, without implying any affiliation, endorsement, or partnership.
We make no representations or warranties, express or implied, regarding the accuracy, completeness, or suitability of any content or products presented. Nothing on this website should be construed as legal, tax, investment, financial, medical, or other professional advice. In addition, no part of this site—including articles or product references—constitutes a solicitation, recommendation, endorsement, advertisement, or offer to buy or sell any securities, franchises, or other financial instruments, particularly in jurisdictions where such activity would be unlawful.
All content is of a general nature and may not address the specific circumstances of any individual or entity. It is not a substitute for professional advice or services. Any actions you take based on the information provided here are strictly at your own risk. You accept full responsibility for any decisions or outcomes arising from your use of this website and agree to release us from any liability in connection with your use of, or reliance upon, the content or products found herein.