
|
RailTel Corporation of India Limited (RAILTEL.NS) DCF Valuation |
Fully Editable: Tailor To Your Needs In Excel Or Sheets
Professional Design: Trusted, Industry-Standard Templates
Investor-Approved Valuation Models
MAC/PC Compatible, Fully Unlocked
No Expertise Is Needed; Easy To Follow
RailTel Corporation of India Limited (RAILTEL.NS) Bundle
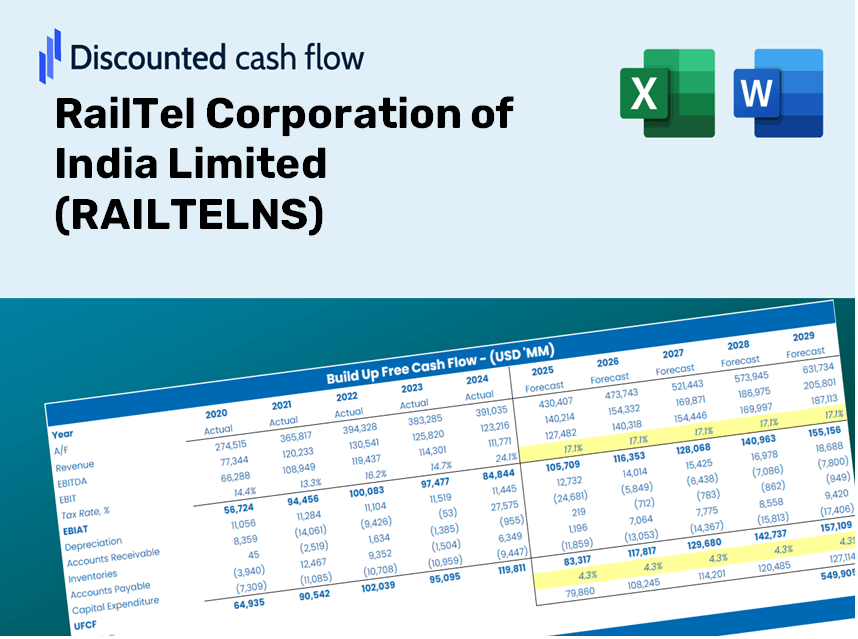
Explore the financial future of RailTel Corporation of India Limited (RAILTELNS) with our user-friendly DCF Calculator! Enter your assumptions regarding growth, margins, and costs to calculate the intrinsic value of RailTel Corporation of India Limited (RAILTELNS) and enhance your investment strategy.
What You Will Receive
- Authentic RailTel Data: Preloaded financials – including revenue and EBIT – drawn from actual and projected figures.
- comprehensive Customization: Modify all key parameters (yellow cells) such as WACC, growth %, and tax rates to suit your needs.
- Real-Time Valuation Updates: Automatic recalibrations to assess the impact of changes on RailTel's fair value.
- Flexible Excel Template: Designed for easy modifications, scenario analyses, and in-depth forecasts.
- Efficient and Precise: Eliminate the need to build models from scratch while ensuring accuracy and adaptability.
Key Features
- Authentic RailTel Financials: Gain access to precise historical data and future forecasts tailored to RailTel Corporation of India Limited (RAILTELNS).
- Tailored Forecast Assumptions: Modify highlighted fields, including WACC, growth rates, and profit margins, to suit your analysis.
- Real-Time Calculations: Enjoy automatic updates for DCF, Net Present Value (NPV), and cash flow assessments.
- User-Friendly Dashboard: Utilize clear charts and summaries to effectively visualize your valuation insights.
- Ideal for All Skill Levels: Designed with a straightforward structure for investors, CFOs, and consultants alike.
How It Functions
- Step 1: Download the Excel file.
- Step 2: Examine the pre-filled RailTel data (historical and forecasted).
- Step 3: Modify key assumptions (highlighted in yellow) based on your insights.
- Step 4: Observe automatic updates for RailTel's intrinsic value.
- Step 5: Utilize the results for investment choices or reporting.
Why Choose This Calculator for RailTel Corporation of India Limited (RAILTELNS)?
- Precise Financials: Utilize accurate RailTel financial data for trustworthy valuation outcomes.
- Tailored Options: Modify essential factors such as growth rates, WACC, and tax rates to align with your forecasts.
- Efficient: Pre-configured calculations save you time by removing the need to build models from the ground up.
- Expert-Quality Tool: Specifically crafted for investors, analysts, and consultants working with RailTel.
- Easy to Use: User-friendly design and comprehensive instructions ensure accessibility for all skill levels.
Who Should Consider RailTel Corporation of India Limited (RAILTELNS)?
- Professional Investors: Develop comprehensive and reliable valuation models for evaluating investment opportunities in the telecommunications sector.
- Corporate Finance Teams: Assess valuation scenarios to inform strategic decisions within their organizations.
- Consultants and Advisors: Equip clients with precise valuation insights regarding RailTel Corporation (RAILTELNS) to enhance their investment strategies.
- Students and Educators: Utilize real-world data to practice financial modeling and impart knowledge in academic settings.
- Telecom Enthusiasts: Gain insights into how companies like RailTel Corporation (RAILTELNS) are valued within the telecommunications market.
Contents of the Template
- Preloaded RAILTEL Data: Historical and projected financial information, encompassing revenue, EBIT, and capital expenditures.
- DCF and WACC Models: High-quality spreadsheets for assessing intrinsic value and Weighted Average Cost of Capital.
- Editable Inputs: Yellow-highlighted cells for modifying revenue growth, tax rates, and discount rates.
- Financial Statements: Detailed annual and quarterly financial reports for in-depth analysis.
- Key Ratios: An array of profitability, leverage, and efficiency ratios for performance evaluation.
- Dashboard and Charts: Visual representations of valuation results and underlying assumptions.
Disclaimer
All information, articles, and product details provided on this website are for general informational and educational purposes only. We do not claim any ownership over, nor do we intend to infringe upon, any trademarks, copyrights, logos, brand names, or other intellectual property mentioned or depicted on this site. Such intellectual property remains the property of its respective owners, and any references here are made solely for identification or informational purposes, without implying any affiliation, endorsement, or partnership.
We make no representations or warranties, express or implied, regarding the accuracy, completeness, or suitability of any content or products presented. Nothing on this website should be construed as legal, tax, investment, financial, medical, or other professional advice. In addition, no part of this site—including articles or product references—constitutes a solicitation, recommendation, endorsement, advertisement, or offer to buy or sell any securities, franchises, or other financial instruments, particularly in jurisdictions where such activity would be unlawful.
All content is of a general nature and may not address the specific circumstances of any individual or entity. It is not a substitute for professional advice or services. Any actions you take based on the information provided here are strictly at your own risk. You accept full responsibility for any decisions or outcomes arising from your use of this website and agree to release us from any liability in connection with your use of, or reliance upon, the content or products found herein.