
|
Rainbow Children's Medicare Limited (RAINBOW.NS) DCF Valuation |
Fully Editable: Tailor To Your Needs In Excel Or Sheets
Professional Design: Trusted, Industry-Standard Templates
Investor-Approved Valuation Models
MAC/PC Compatible, Fully Unlocked
No Expertise Is Needed; Easy To Follow
Rainbow Children's Medicare Limited (RAINBOW.NS) Bundle
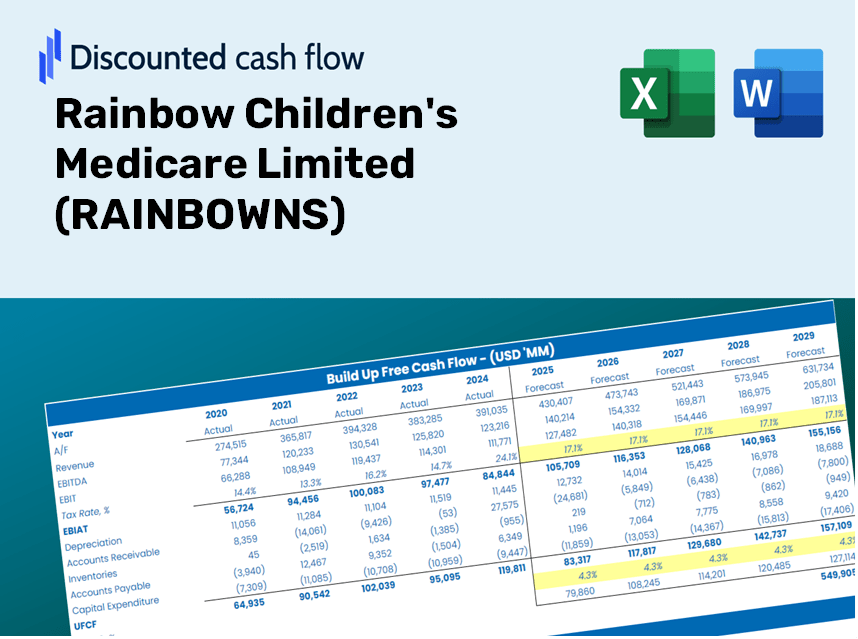
As an investor or analyst, the (RAINBOWNS) DCF Calculator is your go-to resource for accurate valuation. Equipped with real data from Rainbow Children's Medicare Limited, you can easily adjust forecasts and instantly observe the effects.
Discounted Cash Flow (DCF) - (USD MM)
| Year | AY1 2021 |
AY2 2022 |
AY3 2023 |
AY4 2024 |
AY5 2025 |
FY1 2026 |
FY2 2027 |
FY3 2028 |
FY4 2029 |
FY5 2030 |
|---|---|---|---|---|---|---|---|---|---|---|
| Revenue | 6,500.5 | 9,737.6 | 11,735.7 | 12,969.0 | 15,158.7 | 18,861.6 | 23,469.0 | 29,201.9 | 36,335.3 | 45,211.1 |
| Revenue Growth, % | 0 | 49.8 | 20.52 | 10.51 | 16.88 | 24.43 | 24.43 | 24.43 | 24.43 | 24.43 |
| EBITDA | 1,754.1 | 3,267.8 | 4,298.1 | 4,694.3 | 4,898.9 | 6,249.9 | 7,776.6 | 9,676.3 | 12,040.0 | 14,981.1 |
| EBITDA, % | 26.98 | 33.56 | 36.62 | 36.2 | 32.32 | 33.14 | 33.14 | 33.14 | 33.14 | 33.14 |
| Depreciation | 733.4 | 832.6 | 902.7 | 1,120.8 | 1,384.4 | 1,708.8 | 2,126.3 | 2,645.7 | 3,291.9 | 4,096.1 |
| Depreciation, % | 11.28 | 8.55 | 7.69 | 8.64 | 9.13 | 9.06 | 9.06 | 9.06 | 9.06 | 9.06 |
| EBIT | 1,020.7 | 2,435.2 | 3,395.4 | 3,573.4 | 3,514.5 | 4,541.1 | 5,650.4 | 7,030.6 | 8,748.1 | 10,885.0 |
| EBIT, % | 15.7 | 25.01 | 28.93 | 27.55 | 23.18 | 24.08 | 24.08 | 24.08 | 24.08 | 24.08 |
| Total Cash | 1,029.6 | 2,025.8 | 3,808.7 | 5,020.9 | 6,936.0 | 5,793.0 | 7,208.1 | 8,968.8 | 11,159.7 | 13,885.8 |
| Total Cash, percent | .0 | .0 | .0 | .0 | .0 | .0 | .0 | .0 | .0 | .0 |
| Account Receivables | 740.1 | 404.1 | 607.8 | 704.4 | 773.0 | 1,178.6 | 1,466.6 | 1,824.8 | 2,270.6 | 2,825.2 |
| Account Receivables, % | 11.39 | 4.15 | 5.18 | 5.43 | 5.1 | 6.25 | 6.25 | 6.25 | 6.25 | 6.25 |
| Inventories | 101.0 | 148.2 | 187.6 | 239.8 | 275.7 | 314.7 | 391.5 | 487.2 | 606.2 | 754.3 |
| Inventories, % | 1.55 | 1.52 | 1.6 | 1.85 | 1.82 | 1.67 | 1.67 | 1.67 | 1.67 | 1.67 |
| Accounts Payable | 537.3 | 643.7 | 789.0 | 815.0 | 909.7 | 1,278.2 | 1,590.5 | 1,979.0 | 2,462.4 | 3,063.9 |
| Accounts Payable, % | 8.26 | 6.61 | 6.72 | 6.28 | 6 | 6.78 | 6.78 | 6.78 | 6.78 | 6.78 |
| Capital Expenditure | -761.0 | -622.3 | -1,413.0 | -3,535.8 | -1,456.7 | -2,527.8 | -3,145.3 | -3,913.7 | -4,869.7 | -6,059.2 |
| Capital Expenditure, % | -11.71 | -6.39 | -12.04 | -27.26 | -9.61 | -13.4 | -13.4 | -13.4 | -13.4 | -13.4 |
| Tax Rate, % | 26.24 | 26.24 | 26.24 | 26.24 | 26.24 | 26.24 | 26.24 | 26.24 | 26.24 | 26.24 |
| EBITAT | 733.4 | 1,797.2 | 2,540.5 | 2,630.3 | 2,592.4 | 3,340.9 | 4,157.0 | 5,172.4 | 6,435.9 | 8,008.0 |
| Depreciation | ||||||||||
| Changes in Account Receivables | ||||||||||
| Changes in Inventories | ||||||||||
| Changes in Accounts Payable | ||||||||||
| Capital Expenditure | ||||||||||
| UFCF | 401.9 | 2,402.8 | 1,932.5 | 92.4 | 2,510.4 | 2,445.8 | 3,085.3 | 3,839.0 | 4,776.8 | 5,943.7 |
| WACC, % | 4.78 | 4.79 | 4.79 | 4.79 | 4.79 | 4.79 | 4.79 | 4.79 | 4.79 | 4.79 |
| PV UFCF | ||||||||||
| SUM PV UFCF | 17,146.7 | |||||||||
| Long Term Growth Rate, % | 4.00 | |||||||||
| Free cash flow (T + 1) | 6,181 | |||||||||
| Terminal Value | 784,893 | |||||||||
| Present Terminal Value | 621,244 | |||||||||
| Enterprise Value | 638,391 | |||||||||
| Net Debt | 7,433 | |||||||||
| Equity Value | 630,958 | |||||||||
| Diluted Shares Outstanding, MM | 102 | |||||||||
| Equity Value Per Share | 6,179.38 |
What You Will Receive
- Authentic Rainbow Data: Preloaded financial information – from revenue to EBIT – based on actual and projected metrics.
- Comprehensive Customization: Modify all essential parameters (yellow cells) such as WACC, growth %, and tax rates.
- Immediate Valuation Updates: Automatic recalculations to assess the effects of changes on Rainbow Children's Medicare Limited’s fair value.
- Flexible Excel Template: Designed for swift adjustments, scenario analysis, and in-depth projections.
- Time-Efficient and Precise: Avoid the hassle of building models from scratch while ensuring accuracy and adaptability.
Key Features of Rainbow Children's Medicare Limited (RAINBOWNS)
- Customizable Forecast Inputs: Adjust essential parameters such as patient growth rate, service revenue %, and operational expenses.
- Instant DCF Valuation: Quickly computes intrinsic value, net present value (NPV), and additional financial metrics.
- High-Precision Accuracy: Leverages Rainbow's real-world financial data to deliver credible valuation results.
- Effortless Scenario Analysis: Explore various assumptions and easily compare different outcomes.
- Efficiency Booster: Streamlines the valuation process by eliminating the need to create complex models from the ground up.
How It Functions
- Step 1: Download the Excel file.
- Step 2: Examine the pre-filled Rainbow Children's Medicare Limited (RAINBOWNS) data (historical and projected).
- Step 3: Modify key assumptions (yellow cells) based on your findings.
- Step 4: Observe automatic updates reflecting Rainbow Children's intrinsic value.
- Step 5: Utilize the results for investment choices or reporting needs.
Why Opt for This Calculator?
- Comprehensive Resource: Offers DCF, WACC, and financial ratio analyses all in one convenient tool.
- Flexible Inputs: Modify the yellow-highlighted cells to explore various scenarios.
- In-Depth Analysis: Automatically determines Rainbow Children's Medicare Limited’s intrinsic value and Net Present Value.
- Preloaded Information: Features historical and projected data for reliable starting points.
- High-Quality Standards: Perfect for financial analysts, investors, and business consultants.
Who Can Benefit from This Product?
- Investors: Accurately evaluate the fair value of Rainbow Children's Medicare Limited (RAINBOWNS) prior to making investment choices.
- CFOs: Utilize a professional-grade DCF model for financial assessments and reporting.
- Consultants: Seamlessly customize the template for client valuation reports.
- Entrepreneurs: Discover insights into the financial modeling techniques used by leading healthcare companies.
- Educators: Employ it as a teaching resource to illustrate valuation methodologies in finance.
Contents of the Template
- Preloaded RAINBOWNS Data: Historical and projected financial information, including revenue, EBIT, and capital expenditures.
- DCF and WACC Models: Advanced spreadsheets for calculating intrinsic value and Weighted Average Cost of Capital.
- Editable Inputs: Yellow-highlighted cells allowing adjustments for revenue growth, tax rates, and discount rates.
- Financial Statements: Detailed annual and quarterly financials for thorough analysis.
- Key Ratios: Metrics for profitability, leverage, and efficiency to assess performance.
- Dashboard and Charts: Visual representations of valuation results and underlying assumptions.
Disclaimer
All information, articles, and product details provided on this website are for general informational and educational purposes only. We do not claim any ownership over, nor do we intend to infringe upon, any trademarks, copyrights, logos, brand names, or other intellectual property mentioned or depicted on this site. Such intellectual property remains the property of its respective owners, and any references here are made solely for identification or informational purposes, without implying any affiliation, endorsement, or partnership.
We make no representations or warranties, express or implied, regarding the accuracy, completeness, or suitability of any content or products presented. Nothing on this website should be construed as legal, tax, investment, financial, medical, or other professional advice. In addition, no part of this site—including articles or product references—constitutes a solicitation, recommendation, endorsement, advertisement, or offer to buy or sell any securities, franchises, or other financial instruments, particularly in jurisdictions where such activity would be unlawful.
All content is of a general nature and may not address the specific circumstances of any individual or entity. It is not a substitute for professional advice or services. Any actions you take based on the information provided here are strictly at your own risk. You accept full responsibility for any decisions or outcomes arising from your use of this website and agree to release us from any liability in connection with your use of, or reliance upon, the content or products found herein.