
|
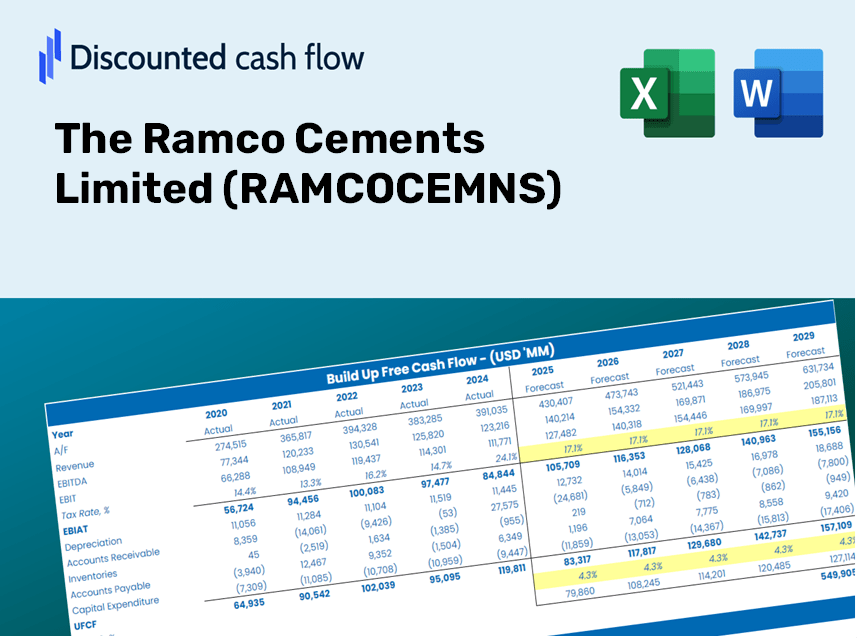
The Ramco Cements Limited (RAMCOCEM.NS) DCF Valuation |
Fully Editable: Tailor To Your Needs In Excel Or Sheets
Professional Design: Trusted, Industry-Standard Templates
Investor-Approved Valuation Models
MAC/PC Compatible, Fully Unlocked
No Expertise Is Needed; Easy To Follow
The Ramco Cements Limited (RAMCOCEM.NS) Bundle
Enhance your investment strategies with the (RAMCOCEMNS) DCF Calculator! Utilize real financial data from The Ramco Cements Limited, adjust growth projections and expenses, and instantly observe how these modifications affect the intrinsic value of (RAMCOCEMNS).
Discounted Cash Flow (DCF) - (USD MM)
| Year | AY1 2021 |
AY2 2022 |
AY3 2023 |
AY4 2024 |
AY5 2025 |
FY1 2026 |
FY2 2027 |
FY3 2028 |
FY4 2029 |
FY5 2030 |
|---|---|---|---|---|---|---|---|---|---|---|
| Revenue | 52,910.0 | 60,036.9 | 81,572.6 | 93,763.5 | 85,184.0 | 96,925.6 | 110,285.7 | 125,487.3 | 142,784.2 | 162,465.4 |
| Revenue Growth, % | 0 | 13.47 | 35.87 | 14.94 | -9.15 | 13.78 | 13.78 | 13.78 | 13.78 | 13.78 |
| EBITDA | 15,627.3 | 12,970.4 | 11,912.7 | 15,694.7 | 12,376.3 | 18,805.7 | 21,397.8 | 24,347.3 | 27,703.3 | 31,521.8 |
| EBITDA, % | 29.54 | 21.6 | 14.6 | 16.74 | 14.53 | 19.4 | 19.4 | 19.4 | 19.4 | 19.4 |
| Depreciation | 3,520.8 | 3,973.0 | 5,006.6 | 6,413.4 | 6,905.2 | 6,659.9 | 7,577.9 | 8,622.4 | 9,810.9 | 11,163.2 |
| Depreciation, % | 6.65 | 6.62 | 6.14 | 6.84 | 8.11 | 6.87 | 6.87 | 6.87 | 6.87 | 6.87 |
| EBIT | 12,106.5 | 8,997.4 | 6,906.1 | 9,281.3 | 5,471.1 | 12,145.8 | 13,820.0 | 15,724.9 | 17,892.4 | 20,358.6 |
| EBIT, % | 22.88 | 14.99 | 8.47 | 9.9 | 6.42 | 12.53 | 12.53 | 12.53 | 12.53 | 12.53 |
| Total Cash | 1,081.1 | 1,461.8 | 1,625.6 | 1,237.4 | 2,091.5 | 1,986.2 | 2,260.0 | 2,571.5 | 2,925.9 | 3,329.2 |
| Total Cash, percent | .0 | .0 | .0 | .0 | .0 | .0 | .0 | .0 | .0 | .0 |
| Account Receivables | 3,828.5 | 3,591.6 | 4,705.2 | 8,602.5 | 7,295.9 | 7,119.4 | 8,100.7 | 9,217.3 | 10,487.7 | 11,933.4 |
| Account Receivables, % | 7.24 | 5.98 | 5.77 | 9.17 | 8.56 | 7.35 | 7.35 | 7.35 | 7.35 | 7.35 |
| Inventories | 5,993.4 | 8,344.7 | 8,836.1 | 9,834.8 | 10,161.8 | 11,335.9 | 12,898.4 | 14,676.3 | 16,699.2 | 19,001.0 |
| Inventories, % | 11.33 | 13.9 | 10.83 | 10.49 | 11.93 | 11.7 | 11.7 | 11.7 | 11.7 | 11.7 |
| Accounts Payable | 3,645.2 | 4,851.1 | 6,385.8 | 9,394.3 | 9,394.3 | 8,499.5 | 9,671.0 | 11,004.1 | 12,520.9 | 14,246.7 |
| Accounts Payable, % | 6.89 | 8.08 | 7.83 | 10.02 | 11.03 | 8.77 | 8.77 | 8.77 | 8.77 | 8.77 |
| Capital Expenditure | -17,670.1 | -18,165.8 | -17,657.9 | -19,225.4 | -10,240.2 | -22,840.8 | -25,989.2 | -29,571.5 | -33,647.5 | -38,285.5 |
| Capital Expenditure, % | -33.4 | -30.26 | -21.65 | -20.5 | -12.02 | -23.57 | -23.57 | -23.57 | -23.57 | -23.57 |
| Tax Rate, % | 14.99 | 14.99 | 14.99 | 14.99 | 14.99 | 14.99 | 14.99 | 14.99 | 14.99 | 14.99 |
| EBITAT | 8,148.7 | 10,007.1 | 4,884.0 | 6,620.4 | 4,650.8 | 9,579.8 | 10,900.2 | 12,402.7 | 14,112.3 | 16,057.5 |
| Depreciation | ||||||||||
| Changes in Account Receivables | ||||||||||
| Changes in Inventories | ||||||||||
| Changes in Accounts Payable | ||||||||||
| Capital Expenditure | ||||||||||
| UFCF | -12,177.3 | -5,094.2 | -7,837.6 | -8,079.1 | 2,295.4 | -8,493.5 | -8,883.3 | -10,107.8 | -11,501.0 | -13,086.3 |
| WACC, % | 4.99 | 5.51 | 5.04 | 5.05 | 5.27 | 5.17 | 5.17 | 5.17 | 5.17 | 5.17 |
| PV UFCF | ||||||||||
| SUM PV UFCF | -44,362.9 | |||||||||
| Long Term Growth Rate, % | 4.00 | |||||||||
| Free cash flow (T + 1) | -13,610 | |||||||||
| Terminal Value | -1,159,223 | |||||||||
| Present Terminal Value | -900,791 | |||||||||
| Enterprise Value | -945,154 | |||||||||
| Net Debt | 44,655 | |||||||||
| Equity Value | -989,809 | |||||||||
| Diluted Shares Outstanding, MM | 236 | |||||||||
| Equity Value Per Share | -4,187.40 |
What You Will Receive
- Authentic RAMCOCEMNS Financial Data: Pre-loaded with historical and forecasted figures for accurate analysis.
- Customizable Template: Easily adjust key variables such as revenue growth, WACC, and EBITDA percentage.
- Instant Calculations: Watch the intrinsic value of RAMCOCEMNS update immediately as you modify inputs.
- Expert Valuation Tool: Tailored for investors, analysts, and consultants aiming for reliable DCF results.
- User-Friendly Interface: Intuitive layout and straightforward instructions suitable for all skill levels.
Key Features
- Comprehensive RAMCOCEMNS Data: Pre-filled with The Ramco Cements Limited's historical financials and future projections.
- Customizable Financial Inputs: Modify revenue growth, profit margins, WACC, tax rates, and capital expenses to suit your analysis.
- Dynamic Valuation Framework: Automatically refreshes Net Present Value (NPV) and intrinsic value based on your adjustments.
- Scenario Analysis: Develop various forecasting scenarios to evaluate different valuation possibilities.
- User-Centric Interface: Intuitive, organized, and crafted for both professionals and novices.
How It Works
- 1. Access the Template: Download and open the Excel file containing the preloaded data for The Ramco Cements Limited (RAMCOCEMNS).
- 2. Adjust Key Inputs: Modify essential parameters such as growth rates, WACC, and capital expenditures as needed.
- 3. View Results in Real-Time: The DCF model automatically calculates the intrinsic value and NPV based on your inputs.
- 4. Explore Various Scenarios: Run multiple forecasts to evaluate different valuation scenarios and outcomes.
- 5. Present with Assurance: Share professional valuation insights to bolster your strategic decisions.
Why Select The Ramco Cements Limited (RAMCOCEMNS) Calculator?
- Time Efficient: Get started immediately without the hassle of building a DCF model from the ground up.
- Enhanced Precision: Dependable financial data and formulas minimize errors in your valuation process.
- Fully Adaptable: Customize the model to suit your specific assumptions and forecasts.
- Simple to Analyze: Intuitive charts and outputs facilitate easy interpretation of results.
- Relied Upon by Professionals: Crafted for experts who prioritize accuracy and ease of use.
Who Can Benefit from This Product?
- Investors: Gain confidence in your investment choices with a top-tier valuation tool tailored for RAMCOCEMNS (RAMCOCEMNS).
- Financial Analysts: Streamline your workflow with a customizable DCF model designed for efficiency.
- Consultants: Effortlessly modify the template for impactful client presentations or detailed reports.
- Finance Enthusiasts: Enhance your knowledge of valuation methods through practical, real-world applications related to RAMCOCEMNS (RAMCOCEMNS).
- Educators and Students: Utilize this resource as an effective teaching aid in finance courses focused on corporate valuation.
What the Template Contains
- Pre-Filled DCF Model: The Ramco Cements Limited’s financial data preloaded for immediate use.
- WACC Calculator: Comprehensive calculations for the Weighted Average Cost of Capital.
- Financial Ratios: Analyze RAMCOCEMNS's profitability, leverage, and operational efficiency.
- Editable Inputs: Modify assumptions like growth rates, profit margins, and CAPEX to align with your specific scenarios.
- Financial Statements: Access annual and quarterly reports to facilitate in-depth analysis.
- Interactive Dashboard: Effortlessly visualize critical valuation metrics and outcomes.
Disclaimer
All information, articles, and product details provided on this website are for general informational and educational purposes only. We do not claim any ownership over, nor do we intend to infringe upon, any trademarks, copyrights, logos, brand names, or other intellectual property mentioned or depicted on this site. Such intellectual property remains the property of its respective owners, and any references here are made solely for identification or informational purposes, without implying any affiliation, endorsement, or partnership.
We make no representations or warranties, express or implied, regarding the accuracy, completeness, or suitability of any content or products presented. Nothing on this website should be construed as legal, tax, investment, financial, medical, or other professional advice. In addition, no part of this site—including articles or product references—constitutes a solicitation, recommendation, endorsement, advertisement, or offer to buy or sell any securities, franchises, or other financial instruments, particularly in jurisdictions where such activity would be unlawful.
All content is of a general nature and may not address the specific circumstances of any individual or entity. It is not a substitute for professional advice or services. Any actions you take based on the information provided here are strictly at your own risk. You accept full responsibility for any decisions or outcomes arising from your use of this website and agree to release us from any liability in connection with your use of, or reliance upon, the content or products found herein.