
|
RateGain Travel Technologies Limited (RATEGAIN.NS): BCG Matrix [Dec-2025 Updated] |
Fully Editable: Tailor To Your Needs In Excel Or Sheets
Professional Design: Trusted, Industry-Standard Templates
Investor-Approved Valuation Models
MAC/PC Compatible, Fully Unlocked
No Expertise Is Needed; Easy To Follow
RateGain Travel Technologies Limited (RATEGAIN.NS) Bundle
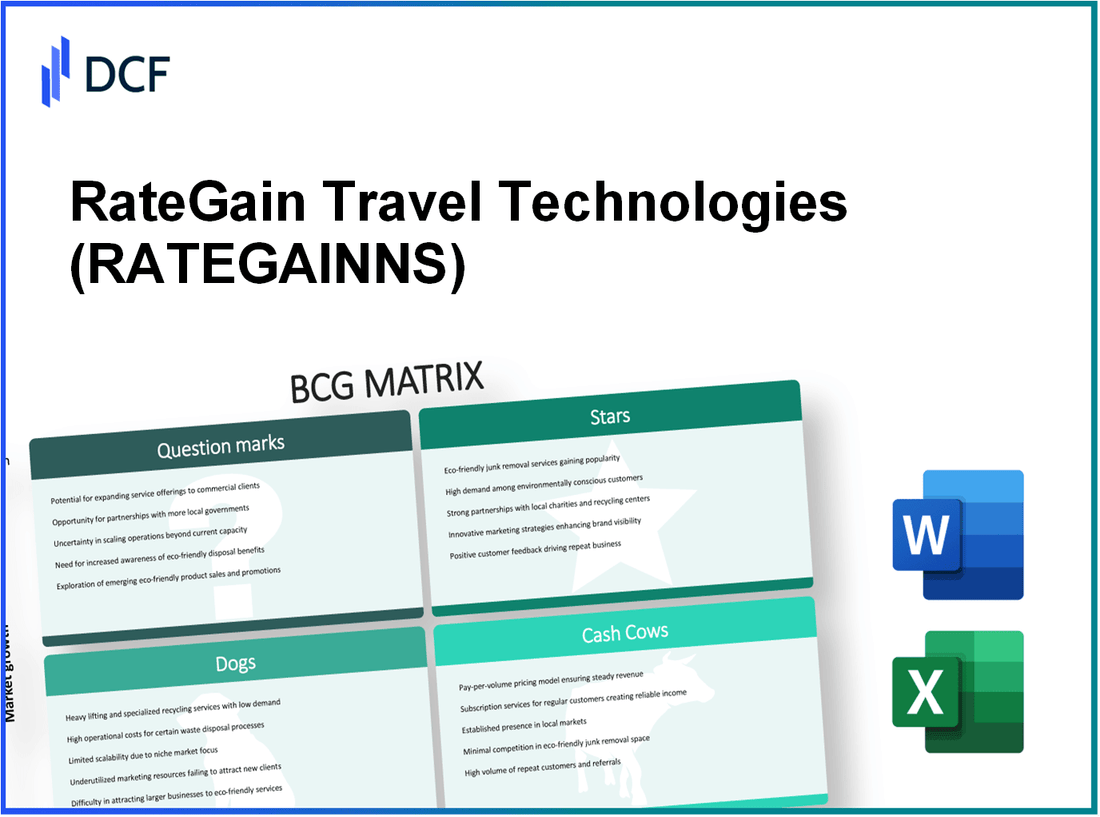
RateGain's portfolio pairs high‑growth, high‑margin stars-Data as a Service, AI products and the AirGain airline platform-that are driving valuation, with reliable cash cows in distribution, global connectivity and RezNext that generate the free cash to fund aggressive bets; meanwhile, capital‑intensive question marks (Adara, Demand.ai, Content AI) need targeted investment to convert market momentum into share, and underperforming legacy dogs are being wound down or divested-a mix that signals disciplined capital allocation focused on scaling SaaS winners while pruning drag assets. Continue to see how these allocations shape RateGain's competitive trajectory.
RateGain Travel Technologies Limited (RATEGAIN.NS) - BCG Matrix Analysis: Stars
DATA AS A SERVICE DRIVES EXPONENTIAL REVENUE - The Data as a Service (DaaS) segment contributes 34% of group revenue as of December 2025, operating in a market growing at 19% CAGR driven by AI-enabled pricing and distribution intelligence demands. RateGain holds a 22% global market share in hospitality data intelligence. The segment reports an EBITDA margin of 26% and requires CAPEX of 8% of segment revenue for server, storage and cloud infrastructure scaling. Given high market growth and leading share, DaaS is positioned as a Star and a primary valuation engine for the group.
| Metric | Value |
|---|---|
| Contribution to group revenue (Dec 2025) | 34% |
| Market growth rate (hospitality data intelligence) | 19% CAGR |
| RateGain market share (global) | 22% |
| EBITDA margin (segment) | 26% |
| CAPEX requirement (segment revenue) | 8% |
| Primary drivers | AI-driven pricing, real-time rate intelligence, expanded property coverage |
AI POWERED PRODUCTS CAPTURE EMERGING MARKET SHARE - The AI-led product suite grew 25% YoY in the current fiscal year and now accounts for 12% of total revenue, up from single-digit percentages in prior years. RateGain has captured a 15% share of the emerging predictive analytics segment for mid-market hotels. Estimated ROI for this business unit is 22%, reflecting scalable algorithmic margins. The segment reinvests 10% of its revenue into R&D for model development, data labeling and compute resources, sustaining rapid feature rollout and competitive differentiation.
- Revenue mix contribution (current fiscal year): 12%
- YoY growth rate: 25%
- Market share (predictive analytics for mid-market hotels): 15%
- Estimated ROI: 22%
- R&D reinvestment: 10% of segment revenue
- Key investments: proprietary algorithms, model explainability, data partnerships
| AI Product Metric | Value |
|---|---|
| Revenue share of company | 12% |
| Year-on-year growth | 25% |
| Market share (mid-market predictive analytics) | 15% |
| ROI | 22% |
| R&D spend (% of segment revenue) | 10% |
AIRGAIN PLATFORM DOMINATES AIRLINE PRICING INTELLIGENCE - The AirGain platform holds a 20% market share in airline price optimization, with product-line revenue up 21% over the twelve months ending December 2025. Gross margin stands at 75%, consistent with high-margin SaaS economics. Customer retention is 95% among low-cost carriers (LCCs) globally, supported by strategic investments in real-time data processing and streaming ingestion. AirGain operates in an 18% growth industry and exhibits metrics characteristic of a Star: high relative market share and above-average market growth, justifying continued investment to defend leadership and extend into yield management adjacent services.
- Market share (airline price optimization): 20%
- Revenue growth (last 12 months to Dec 2025): 21%
- Gross margin: 75%
- Customer retention (LCCs): 95%
- Industry growth rate: 18% CAGR
- Strategic capex/opex focus: real-time processing, low-latency pipelines
| AirGain Metric | Value |
|---|---|
| Market share | 20% |
| 12-month revenue growth | 21% |
| Gross margin | 75% |
| Customer retention (LCCs) | 95% |
| Industry growth | 18% CAGR |
Strategic implications for Stars across the portfolio include prioritized capital allocation to sustain market-leading positions, targeted M&A to expand addressable markets, continued R&D and cloud infrastructure investment, and cross-selling initiatives to convert high-retention customers into multi-product users, thereby increasing lifetime value and preserving high-growth momentum.
RateGain Travel Technologies Limited (RATEGAIN.NS) - BCG Matrix Analysis: Cash Cows
DISTRIBUTION NETWORKS PROVIDE STABLE OPERATING CASH. The Distribution segment was the largest revenue contributor in 2025, accounting for 42% of company revenue. Traditional distribution market growth has slowed to 7% annually, while RateGain holds an estimated 35% share of the global electronic distribution market. The segment generates a 32% EBITDA margin and requires CAPEX of only 4% of segment revenue, enabling high free cash flow conversion. Renewal rates among tier-one global hotel chains are approximately 98%, underpinning predictable recurring income and low customer acquisition spend. Cash produced by this segment is actively allocated to fund sales and R&D for higher-growth, higher-margin product initiatives.
GLOBAL CONNECTIVITY HUB SUSTAINS MARKET DOMINANCE. The connectivity hub links over 250,000 hotel properties with hundreds of demand partners worldwide, producing roughly $150 million in annual recurring revenue (ARR). The asset yields a return on invested capital (ROIC) of ~28% and exhibits very low churn (<3% annual). North American market penetration has reached about 40%, indicating regional saturation and steady, low single-digit growth. The hub functions as a platform for cross-selling SaaS modules and supports integration-driven upsells that improve overall customer lifetime value (LTV).
REZNEXT MID MARKET SOLUTIONS YIELD CONSISTENT RETURNS. RezNext retains roughly 12% share of the mid-market hotel distribution segment in Asia, where niche market growth has stabilized at ~6% per year. The product line delivers a consistent operating margin of 24% and requires negligible incremental CAPEX for ongoing maintenance. RezNext contributes approximately 10% to consolidated revenue and serves as a dependable cash source to underwrite R&D and go-to-market costs for the company's more volatile question-mark businesses.
| Metric | Distribution Segment | Connectivity Hub | RezNext (Mid-market) |
|---|---|---|---|
| 2025 Revenue Contribution | 42% of company revenue | ~$150 million ARR (~-% of company revenue) | 10% of company revenue |
| Market Share | 35% global electronic distribution | Platform coverage: 250,000+ properties | ~12% mid-market share (Asia) |
| Market Growth Rate | ~7% (traditional distribution) | Low single-digit (regional saturation in NA ~40%) | ~6% (mature niche) |
| EBITDA / Operating Margin | 32% EBITDA margin | Notional operating margin: ~30% (platform economics) | 24% operating margin |
| CAPEX Intensity | ~4% of segment revenue | Minimal maintenance CAPEX; major investments infrequent | Near-zero additional CAPEX for maintenance |
| Renewal / Churn | Renewal rate ~98% (tier-one chains) | Churn <3% annually | High renewal; churn negligible |
| Free Cash Flow Profile | High FCF conversion due to low CAPEX and high margins | Stable, predictable FCF supporting cross-sell | Consistent positive FCF used for R&D funding |
| Role in Portfolio | Primary cash cow funding growth units | Foundational platform enabling SaaS upsell | Supplementary cash cow for mid-market investments |
Key operational and strategic implications:
- High margin and low CAPEX enable >30%+ FCF conversion in core distribution, reducing reliance on external financing.
- Connectivity hub's platform effects and low churn make it an ideal base for cross-selling higher-margin SaaS and data products.
- RezNext's stable returns and negligible CAPEX allow reinvestment into R&D and marketing for question-mark segments without diluting core profitability.
- Regional saturation in North America (~40% penetration) signals limited organic growth; management must prioritize monetization and product bundling rather than pure expansion.
- Overall portfolio balance: cash cows supply capital for strategic acquisitions, product development, and go-to-market expansion of higher-growth units.
RateGain Travel Technologies Limited (RATEGAIN.NS) - BCG Matrix Analysis: Question Marks
Dogs (Question Marks): this chapter addresses business units with high market growth but currently low relative market share, requiring investment choices to either build market leadership or divest.
ADARA PLATFORM TARGETS HIGH GROWTH ADVERTISING - The MarTech division centered on the Adara acquisition operates in a digital advertising market growing at 23% CAGR. Adara contributes 24% to RateGain's total revenue (latest FY), while holding a 6% share of the global travel intent data market. EBITDA margin for Adara is 14%, depressed by integration and sales investment. Management has allocated 18% of total company CAPEX to scale Adara across APAC. Key operating metrics: ARR growth ~28% YoY, customer churn ~6% annualized, average deal size USD 120k. Success depends on converting the 23% market growth into dominant share within 24 months.
| Metric | Adara (MarTech) | FY Contribution |
|---|---|---|
| Market Growth (CAGR) | 23% | - |
| Revenue Contribution | - | 24% |
| Global Market Share (travel intent data) | 6% | - |
| EBITDA Margin | 14% | - |
| CAPEX Allocation (company-wide) | 18% | - |
| ARR Growth (YoY) | 28% | - |
| Average Deal Size | USD 120,000 | - |
DEMAND AI VENTURES INTO PREDICTIVE FORECASTING - Demand.ai is a nascent product in hyper-local demand forecasting, operating in a market expanding at 30% annually. It accounts for 5% of RateGain's total revenue, indicating an early-stage placement within the portfolio. Penetration among urban boutique hotels stands at 10%, with substantial runway in mid-market and enterprise segments. Current ROI is approximately 9% as the company prioritizes customer acquisition. Marketing and sales spend represent ~12% of segment revenue. Key unit economics: customer acquisition cost (CAC) USD 3,500, lifetime value (LTV) USD 18,000, payback period ~14 months.
| Metric | Demand.ai |
|---|---|
| Market Growth (CAGR) | 30% |
| Revenue Contribution | 5% |
| Penetration (urban boutique hotels) | 10% |
| ROI | 9% |
| Marketing/Sales Spend (% of segment revenue) | ~12% |
| CAC | USD 3,500 |
| LTV | USD 18,000 |
| Payback Period | ~14 months |
CONTENT AI EXPANDS INTO LUXURY SEGMENTS - Content AI targets automated hotel content management, a market growing at 25% annually. The unit holds under 4% of the global market for automated digital asset management in travel. CAPEX allocation for integrating generative AI features is 15% of company CAPEX. Revenue growth for Content AI registers at 40% YoY, but the product has not yet achieved break-even EBITDA; current EBITDA margin is negative (approx. -6%) as R&D and model training costs remain high. Unit metrics: monthly active customers +35% YoY, average contract value USD 45k, churn 8%.
| Metric | Content AI |
|---|---|
| Market Growth (CAGR) | 25% |
| Global Market Share (automated DAM) | <4% |
| Revenue Growth (YoY) | 40% |
| EBITDA Margin | ~ -6% |
| CAPEX Allocation (company-wide) | 15% |
| Average Contract Value | USD 45,000 |
| Churn | 8% |
Strategic considerations and required actions for these Question Marks:
- Prioritize Adara and Content AI where addressable markets and organic growth provide scale effects; increase sales and integration budgets while tracking payback to achieve >20% EBITDA within 18-24 months.
- For Demand.ai, accelerate go-to-market focused on mid-size chains to lift penetration from 10% to 25% in targeted verticals within two years; optimize CAC to sub-USD 2,500 by channel efficiency.
- Maintain disciplined CAPEX: current allocations (Adara 18%, Content AI 15%) should be conditional on quarterly KPIs-MRR growth, net retention, and unit economics improvement.
- Consider selective M&A or partnerships to buy market share quickly in segments where organic share gain would be slower than market growth.
- Set explicit go/no-go thresholds: convert Question Marks to Stars if relative market share >15% within 24 months and EBITDA margin trending to >20%; otherwise prepare for carve-out or divestiture.
RateGain Travel Technologies Limited (RATEGAIN.NS) - BCG Matrix Analysis: Dogs
LEGACY CUSTOM INTEGRATIONS SHOW REVENUE STAGNATION: Legacy custom software integration services now account for 3.8% of RateGain's total revenue portfolio. This segment is experiencing a negative year-over-year growth rate of -2.0% as enterprise clients migrate to standardized SaaS platforms. Global market share for this niche has declined to 0.9%. The unit delivers a return on investment (ROI) of approximately 5.0%, which barely covers maintenance and personnel costs associated with legacy codebases. Capital expenditure (CAPEX) for this unit has been reduced to zero for FY2025-26, with management prioritizing sunsetting activities and migration support toward core product lines. Contract renewal rates for legacy integrations have fallen to 42% year-on-year, and average contract value (ACV) has declined by 6%.
| Metric | Value | Notes |
|---|---|---|
| Revenue contribution | 3.8% | Of consolidated revenue FY2025 |
| Growth rate (YoY) | -2.0% | As clients migrate to SaaS |
| Global market share | 0.9% | Fragmented niche |
| ROI | 5.0% | Gross ROI after maintenance |
| CAPEX | 0 | Allocated for FY2025-26 |
| Contract renewal rate | 42% | FY2025 |
| Average contract value change | -6% | Decline vs prior year |
NON CORE CONSULTING SERVICES FACE MARKET DECLINE: Standalone consulting services for travel technology implementation contributed 2.0% to RateGain's total group revenue as of December 2025. Demand for manual, onsite consulting dropped by -5.0% over the past 12 months. The broader market for manual consulting in travel tech is contracting at an estimated -10.0% annually as automated SaaS tools and low-code deployment options replace labor-intensive engagements. This business unit operates at a low gross margin of 8.0% and consumes disproportionate management attention relative to its financial contribution. Attrition among senior consultants has increased to 18% annually, driving up hiring costs and reducing utilization to 62%.
- Revenue contribution: 2.0% of group revenue (Dec 2025)
- Demand change (12 months): -5.0%
- Market contraction rate: -10.0% p.a.
- Gross margin: 8.0%
- Employee utilization: 62%
- Senior consultant attrition: 18% p.a.
- Strategic status: Marked for divestment or phased discontinuation
REGIONAL OFFLINE DISTRIBUTION TOOLS LOSE RELEVANCE: Older offline distribution tools targeted at regional travel agencies now hold under 2.0% market share and contribute 1.0% to RateGain's total revenue. Growth in this sub-segment is stagnant at +1.0% and the EBITDA margin for these on-premise products is approximately 6.0%. High maintenance costs for legacy on-premise servers and bespoke deployments yield a negative net ROI when factoring lifecycle replacement and support overheads; net ROI is estimated at -3.0% after capitalized maintenance and amortization. The product line is retained primarily to service a limited set of long-term contracts (approximately 48 active accounts) that are scheduled to expire throughout 2026.
| Metric | Value | Notes |
|---|---|---|
| Market share | <2.0% | Regional offline distribution tools |
| Revenue contribution | 1.0% | Of consolidated revenue |
| Growth rate | +1.0% | Stagnant adoption |
| EBITDA margin | 6.0% | Low-margin legacy product |
| Net ROI | -3.0% | After maintenance & amortization |
| Active contracts | 48 | All expiring by end-2026 |
Collective implications across these Dog units include the following operational and financial pressures:
- Aggregate revenue from Dog segments: ~6.8% of total (Legacy integrations 3.8% + Consulting 2.0% + Offline tools 1.0%)
- Weighted average growth: approximately -1.9% (weighted by revenue contribution)
- Weighted average margin: ~6.3% EBITDA/gross margins
- CAPEX allocation: 0 for legacy integrations, minimal for support of offline tools, limited transitional spend for consulting wind-down
- Strategic actions: accelerated sunsetting, targeted divestment, contract non-renewal planning, reallocation of support headcount to cloud/SaaS product teams
Disclaimer
All information, articles, and product details provided on this website are for general informational and educational purposes only. We do not claim any ownership over, nor do we intend to infringe upon, any trademarks, copyrights, logos, brand names, or other intellectual property mentioned or depicted on this site. Such intellectual property remains the property of its respective owners, and any references here are made solely for identification or informational purposes, without implying any affiliation, endorsement, or partnership.
We make no representations or warranties, express or implied, regarding the accuracy, completeness, or suitability of any content or products presented. Nothing on this website should be construed as legal, tax, investment, financial, medical, or other professional advice. In addition, no part of this site—including articles or product references—constitutes a solicitation, recommendation, endorsement, advertisement, or offer to buy or sell any securities, franchises, or other financial instruments, particularly in jurisdictions where such activity would be unlawful.
All content is of a general nature and may not address the specific circumstances of any individual or entity. It is not a substitute for professional advice or services. Any actions you take based on the information provided here are strictly at your own risk. You accept full responsibility for any decisions or outcomes arising from your use of this website and agree to release us from any liability in connection with your use of, or reliance upon, the content or products found herein.