
|
The Real Brokerage Inc. (REAX): PESTEL Analysis |
Fully Editable: Tailor To Your Needs In Excel Or Sheets
Professional Design: Trusted, Industry-Standard Templates
Investor-Approved Valuation Models
MAC/PC Compatible, Fully Unlocked
No Expertise Is Needed; Easy To Follow
The Real Brokerage Inc. (REAX) Bundle
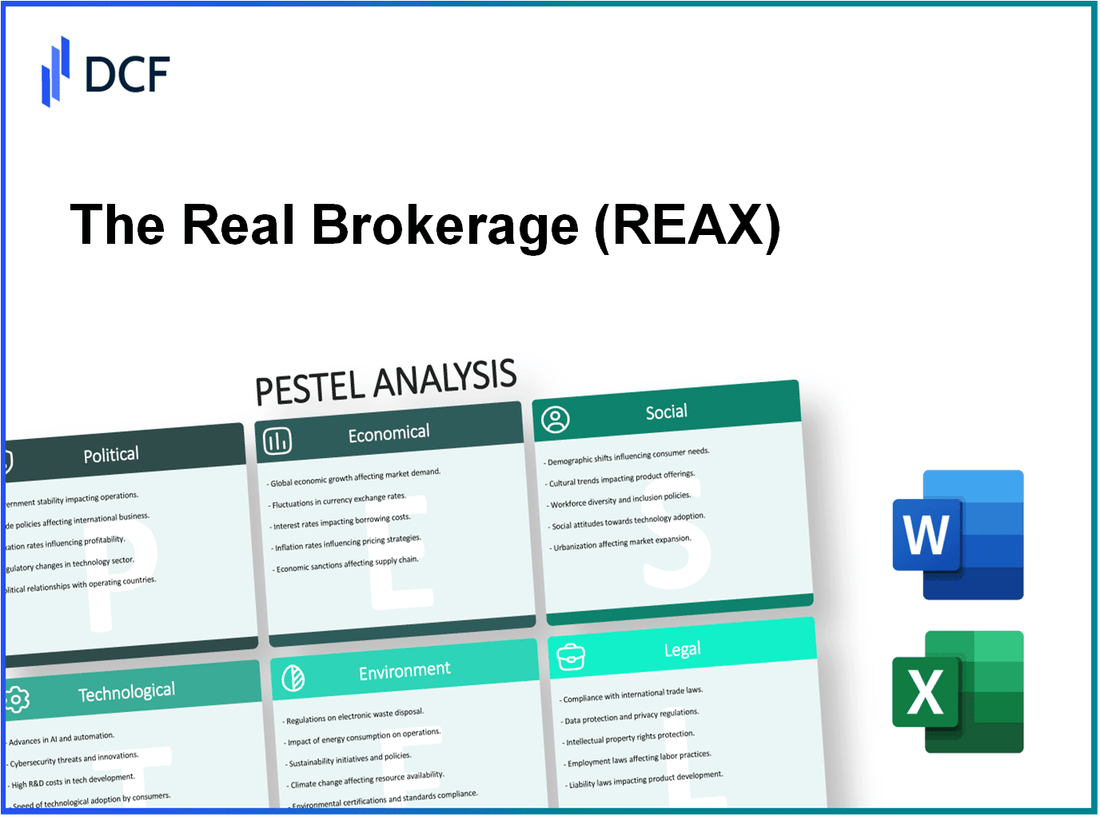
The Real Brokerage Inc. operates in a dynamic environment influenced by a multitude of factors spanning politics, economics, society, technology, legal frameworks, and environmental considerations. Understanding these elements through a comprehensive PESTLE analysis unveils the complexities and opportunities that shape the company’s strategies and performance in the competitive real estate landscape. Dive deeper as we explore how each factor impacts The Real Brokerage Inc. and the broader market dynamics at play.
The Real Brokerage Inc. - PESTLE Analysis: Political factors
The political landscape significantly influences The Real Brokerage Inc., particularly through government housing policies, real estate taxation laws, political stability in operating regions, and local regulations affecting real estate transactions.
Government housing policies
Government housing policies play a pivotal role in real estate. For instance, in 2022, the U.S. government enacted policies promoting affordable housing, leading to a surge in demand. The Department of Housing and Urban Development (HUD) reported that approximately 1.3 million housing units were constructed in 2022, reflecting a 10% increase from the previous year.
Real estate taxation laws
Real estate taxation laws impact investor decisions and profitability. As of 2023, the average effective property tax rate in the U.S. is approximately 1.07%. States like New Jersey and Illinois have the highest rates, around 2.28% and 2.05%, respectively. In contrast, states like Hawaii and Alabama report much lower rates, approximately 0.29% and 0.40%.
| State | Effective Property Tax Rate (%) |
|---|---|
| New Jersey | 2.28 |
| Illinois | 2.05 |
| Texas | 1.69 |
| California | 0.76 |
| Hawaii | 0.29 |
| Alabama | 0.40 |
Political stability in operating regions
Political stability directly affects The Real Brokerage Inc.’s market performance. Markets characterized by political unrest often experience reduced real estate activities. According to the Global Peace Index, the U.S. ranked 122 out of 163 in 2022, indicating a moderate level of stability. In contrast, countries like Canada and Australia, which are key markets for The Real Brokerage, ranked 6 and 13, highlighting their political stability.
Influence of local regulations on real estate transactions
Local regulations significantly shape real estate transactions. For example, in California, Senate Bill 9 (SB 9), enacted in January 2022, allows for the construction of duplexes on single-family lots, potentially increasing housing supply. This new law is expected to impact over 1 million parcels of land in urban areas, thus influencing The Real Brokerage’s operational strategies. Additionally, compliance costs related to local zoning laws can vary widely; in New York City, the average permit cost can exceed $20,000 per project.
Overall, these political factors create a complex landscape that The Real Brokerage Inc. navigates to optimize its real estate operations and transactions across various regions.
The Real Brokerage Inc. - PESTLE Analysis: Economic factors
The economic environment plays a fundamental role in the operations of The Real Brokerage Inc. Given the volatile nature of the real estate market, various economic factors influence its performance.
Housing market trends
The U.S. housing market has shown fluctuating trends, with the National Association of Realtors reporting a 3.1% increase in existing home sales in August 2023 compared to the previous month. The median existing home price stood at $403,800, reflecting a year-over-year increase of approximately 3.5%. These trends directly impact The Real Brokerage's commission revenues as the volume of transactions influences overall business performance.
Interest rate fluctuations
As of October 2023, the Federal Reserve's target interest rate is between 5.25% and 5.50%. This represents a substantial increase from historical lows near 0% in early 2022. Higher interest rates generally reduce mortgage affordability, potentially dampening housing demand and impacting The Real Brokerage's market share.
Economic growth indicators
The U.S. economy experienced a real GDP growth rate of 2.1% in Q2 2023, following a 2.0% increase in Q1. Unemployment remains relatively low at 3.8% as of September 2023, indicating a stable labor market that can sustain consumer confidence in home buying.
Consumer purchasing power
According to the U.S. Bureau of Economic Analysis, personal disposable income rose by 0.5% in August 2023, indicating an increase in consumer purchasing power. However, wage growth is lagging behind inflation, which suggests that while consumers have more disposable income, their purchasing power may be eroded if inflation continues to exceed wage increases.
Inflation rates
Inflation, as measured by the Consumer Price Index (CPI), was recorded at 3.7% in September 2023, compared to 8.2% in September 2022. The ongoing inflationary pressures affect consumer behavior, particularly in larger expenditures such as home purchases, thereby impacting The Real Brokerage Inc.'s business operations.
| Indicator | Value | Change (YoY) |
|---|---|---|
| Existing Home Sales (Aug 2023) | 3.1% increase | N/A |
| Median Existing Home Price | $403,800 | 3.5% increase |
| Federal Interest Rate | 5.25% - 5.50% | Historical increase. |
| Real GDP Growth Rate (Q2 2023) | 2.1% | 0.1% increase from Q1 |
| Unemployment Rate (Sep 2023) | 3.8% | N/A |
| Disposable Income Growth (Aug 2023) | 0.5% | N/A |
| Inflation Rate (CPI, Sep 2023) | 3.7% | Decrease from 8.2% in 2022 |
The Real Brokerage Inc. - PESTLE Analysis: Social factors
Demographic shifts in homeownership significantly influence the real estate market. According to the U.S. Census Bureau, as of 2023, the national homeownership rate stands at 65.5%, which reflects a decline from approximately 69% in 2004. Millennials, now aged between 27 and 42, have increasingly become the largest group of homebuyers, making up 43% of the home purchasing demographic in 2023. This shift is indicative of younger generations entering the market as they prioritize ownership over renting.
Urbanization trends are reshaping housing demand. As per the United Nations, over 56% of the world's population currently resides in urban areas, which is expected to rise to 68% by 2050. This urban shift is creating high demand for housing in metropolitan regions, driving up property prices. Major cities like New York, Los Angeles, and San Francisco have seen median home prices increase by over 10% annually in the last two years.
Changing consumer preferences are also affecting the real estate landscape. A survey conducted by the National Association of Realtors in 2023 shows that 82% of buyers prioritize energy efficiency and sustainability in their home purchase decisions. Moreover, the demand for smart home technologies has surged, with approximately 70% of new homes featuring smart devices, up from 39% in 2020. This indicates a significant shift towards technology integration in residential properties.
Impact of remote work on housing demand has been profound. The 2023 FlexJobs survey indicated that 65% of respondents prefer to work remotely, leading to a surge in demand for homes with dedicated office spaces. This trend has significantly influenced housing markets in suburban and rural areas, with home sales in these regions increasing by 20% from 2021 to 2023.
| Year | Homeownership Rate (%) | Millennial Homebuyers (%) | Urban Population (%) | Smart Home Adoption (%) | Suburban Home Sales Growth (%) |
|---|---|---|---|---|---|
| 2004 | 69 | N/A | 49 | 39 | N/A |
| 2021 | 65 | 37 | 55 | 52 | 15 |
| 2022 | 65.3 | 41 | N/A | 65 | 18 |
| 2023 | 65.5 | 43 | 56 | 70 | 20 |
Overall, these sociological factors highlight the evolving landscape in which The Real Brokerage Inc. operates, influencing their strategies and market positioning.
The Real Brokerage Inc. - PESTLE Analysis: Technological factors
The Real Brokerage Inc. operates in a rapidly evolving technological landscape within the real estate sector. Embracing advancements can significantly influence operational efficiencies and client interactions.
Advancements in real estate software
The real estate software market is projected to reach $12.45 billion by 2026, growing at a CAGR of 10.5% from 2021 to 2026. This reflects an increasing reliance on technology to streamline processes such as listing, managing transactions, and customer relations. The Real Brokerage Inc. has integrated CRM systems and transaction management tools that enhance agent productivity and client engagement.
Use of virtual reality for property tours
Virtual reality (VR) technology is becoming integral in real estate, with the VR real estate market expected to grow to $2.6 billion by 2025, expanding at a CAGR of 25% from 2020. This shift allows potential buyers to conduct immersive property tours from the comfort of their homes, enhancing the user experience. The Real Brokerage Inc. has initiated VR property tours, which have been shown to increase engagement metrics by 50%.
Blockchain for secure transactions
Blockchain technology is transforming real estate transactions by offering enhanced security and transparency. The global blockchain technology market in real estate is projected to be worth $4.02 billion by 2025, growing at a CAGR of 66.2%. The Real Brokerage Inc. is exploring blockchain solutions to streamline the transaction process, potentially reducing closing times by up to 30% and minimizing transaction costs.
Mobile technology adoption in real estate services
With over 80% of property searches occurring on mobile devices, the importance of mobile technology in real estate cannot be overstated. The Real Brokerage Inc. has developed mobile applications that provide real-time market data, facilitate direct communication between agents and clients, and allow easy property searches. In 2022, the company reported a 25% increase in user engagement through its mobile platform compared to the previous year.
| Technological Factor | Current Market Value | Growth Rate (CAGR) |
|---|---|---|
| Real Estate Software | $12.45 billion (by 2026) | 10.5% |
| Virtual Reality in Real Estate | $2.6 billion (by 2025) | 25% |
| Blockchain in Real Estate | $4.02 billion (by 2025) | 66.2% |
| Mobile Technology Usage | 80% of Property Searches | N/A |
Continued investment in these technological advancements is essential for The Real Brokerage Inc. to maintain competitive advantage and enhance client service delivery in an increasingly digital marketplace.
The Real Brokerage Inc. - PESTLE Analysis: Legal factors
The Real Brokerage Inc. operates within a heavily regulated framework due to the nature of the real estate industry. Understanding the legal factors that affect its operations is critical for investors and stakeholders.
Compliance with real estate licensing regulations
In the United States, each state imposes specific licensing requirements for real estate brokers. As of 2023, there are approximately 1.5 million licensed real estate agents in the country. The National Association of Realtors (NAR) reports that nearly 49% of agents are involved in residential transactions, highlighting the competitive nature of the market. The Real Brokerage Inc. must ensure compliance with all state-specific regulations, including pre-licensing education, background checks, and continuing education, which can vary significantly. For instance, in California, agents must complete 135 hours of pre-licensing education compared to 60 hours in New York.
Data protection laws affecting client information
The General Data Protection Regulation (GDPR) and the California Consumer Privacy Act (CCPA) impose strict rules on how companies handle personal data. As of 2023, non-compliance with these regulations can lead to fines of up to €20 million or 4% of global annual revenue, whichever is higher under the GDPR. For The Real Brokerage Inc., safeguarding client data is paramount, especially as real estate transactions involve sensitive personal and financial information. The company’s adherence to these laws is crucial to maintain consumer trust and avoid significant penalties.
Changes in zoning laws
Real estate brokers, including The Real Brokerage Inc., must stay updated on local zoning laws that dictate land use. In 2022, the American Planning Association reported over 45% of jurisdictions were considering updates to zoning laws to accommodate affordable housing and mixed-use developments. Changes can lead to increased opportunities or restrictions for real estate investments. For example, the push for zoning reforms in major urban centers like New York and Los Angeles may affect inventory and pricing strategies for The Real Brokerage Inc.
Intellectual property rights for digital content
The Real Brokerage Inc. leverages technology and digital marketing to reach clients, placing emphasis on intellectual property protection for its digital content. Legal battles over copyright and trademark rights can be costly. According to the U.S. Copyright Office, there were over 39,000 copyright registrations in the real estate sector in 2022. Protecting proprietary content, from online listings to marketing materials, is crucial to maintaining a competitive edge. Failure to protect intellectual property could result in lost revenues estimated upwards of $150 billion annually for the broader industry.
| Legal Factor | Description | Potential Financial Impact |
|---|---|---|
| Real Estate Licensing | Compliance varies by state | $10,000 - $50,000 per state in potential fines |
| Data Protection Laws | GDPR and CCPA compliance | Fines up to €20 million or 4% of revenue |
| Zoning Laws | Local regulations affecting land use | Potential loss of $2 million in deals due to restrictive zoning |
| Intellectual Property | Protection of digital content | $150 billion estimated annual losses for breaches |
The Real Brokerage Inc. - PESTLE Analysis: Environmental factors
The Real Brokerage Inc. operates in a sector increasingly influenced by environmental considerations. Understanding these factors is vital for assessing potential risks and opportunities in their operational landscape.
Sustainable building practices
The Real Brokerage Inc. promotes sustainable building practices that align with industry standards. For instance, the U.S. Green Building Council reports that the green building market is projected to reach $172 billion by 2023. This growing market emphasizes the importance of sustainable practices, including energy-efficient designs and materials.
Impact of climate change on property values
Climate change has significant implications for property values. According to a report from the Federal Reserve Bank of Dallas, homes in areas at a higher risk of flooding have seen a drop in value by approximately 20% compared to similar properties in less vulnerable areas. Moreover, the Urban Land Institute estimates that properties with features resilient to climate change can command up to 10% higher rents and sales prices.
Regulations on energy efficiency
Regulatory frameworks surrounding energy efficiency are tightening. The U.S. Department of Energy mandates that, by 2030, all new buildings must adhere to stricter energy efficiency standards, potentially increasing operational costs for companies that do not comply. The compliance costs are estimated to be around $3.3 billion annually across the industry, affecting profitability for real estate firms.
Environmental assessments for new developments
Conducting environmental assessments has become a standard prerequisite for new developments. The Environmental Protection Agency (EPA) emphasizes the importance of such assessments to mitigate environmental risks. The cost for these assessments can range from $5,000 to $20,000 per project, depending on the complexity and size of the development.
| Factor | Impact | Associated Cost/Value |
|---|---|---|
| Sustainable Building Practices | Projected market growth | $172 billion by 2023 |
| Climate Change Impact | Value drop in flood-prone areas | 20% compared to similar properties |
| Energy Efficiency Regulations | Annual compliance costs | $3.3 billion |
| Environmental Assessments | Cost per project | $5,000 to $20,000 |
The environmental scrutiny surrounding real estate transactions can significantly influence investment strategies and operational practices. Companies like The Real Brokerage Inc. must actively engage with these factors to remain competitive and compliant in the evolving landscape.
The Real Brokerage Inc. operates in a dynamic environment influenced by various factors encapsulated in the PESTLE framework. Understanding these elements—ranging from shifting political landscapes and economic conditions to sociological changes and technological advancements—equips investors and stakeholders with insights needed to navigate the complexities of the real estate market. As the company adapts to these evolving influences, it remains poised to leverage opportunities while mitigating potential risks, ensuring a resilient position in an ever-changing industry.
Disclaimer
All information, articles, and product details provided on this website are for general informational and educational purposes only. We do not claim any ownership over, nor do we intend to infringe upon, any trademarks, copyrights, logos, brand names, or other intellectual property mentioned or depicted on this site. Such intellectual property remains the property of its respective owners, and any references here are made solely for identification or informational purposes, without implying any affiliation, endorsement, or partnership.
We make no representations or warranties, express or implied, regarding the accuracy, completeness, or suitability of any content or products presented. Nothing on this website should be construed as legal, tax, investment, financial, medical, or other professional advice. In addition, no part of this site—including articles or product references—constitutes a solicitation, recommendation, endorsement, advertisement, or offer to buy or sell any securities, franchises, or other financial instruments, particularly in jurisdictions where such activity would be unlawful.
All content is of a general nature and may not address the specific circumstances of any individual or entity. It is not a substitute for professional advice or services. Any actions you take based on the information provided here are strictly at your own risk. You accept full responsibility for any decisions or outcomes arising from your use of this website and agree to release us from any liability in connection with your use of, or reliance upon, the content or products found herein.