
|
Refex Industries Limited (REFEX.NS) DCF Valuation |
Fully Editable: Tailor To Your Needs In Excel Or Sheets
Professional Design: Trusted, Industry-Standard Templates
Investor-Approved Valuation Models
MAC/PC Compatible, Fully Unlocked
No Expertise Is Needed; Easy To Follow
Refex Industries Limited (REFEX.NS) Bundle
Enhance your investment strategies with the Refex Industries Limited (REFEXNS) DCF Calculator! Explore the latest financial data for Refex, adjust growth projections and expenses, and instantly observe how these modifications affect the intrinsic value of Refex Industries Limited (REFEXNS).
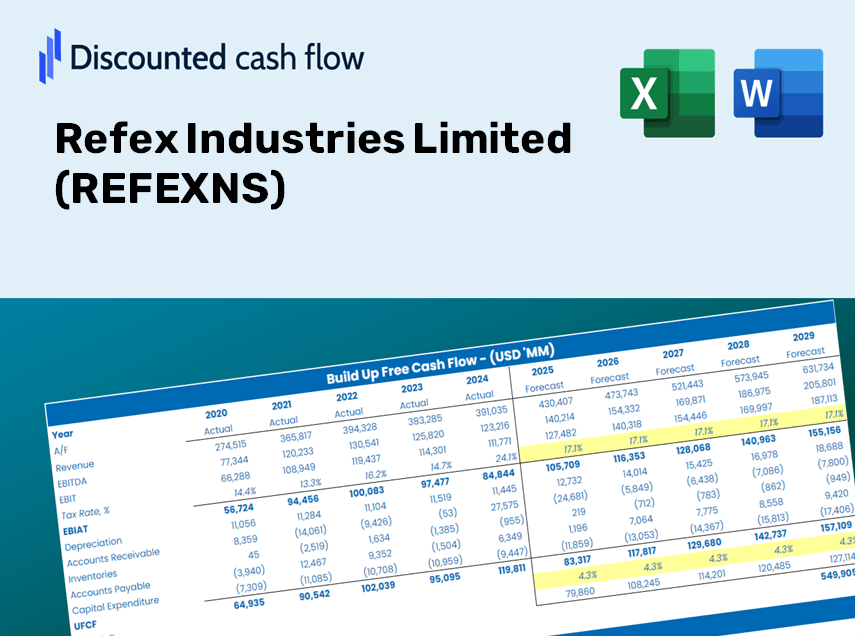
Discounted Cash Flow (DCF) - (USD MM)
| Year | AY1 2021 |
AY2 2022 |
AY3 2023 |
AY4 2024 |
AY5 2025 |
FY1 2026 |
FY2 2027 |
FY3 2028 |
FY4 2029 |
FY5 2030 |
|---|---|---|---|---|---|---|---|---|---|---|
| Revenue | 6,326.6 | 4,439.6 | 16,291.5 | 13,828.7 | 24,676.6 | 32,912.5 | 43,897.2 | 58,548.1 | 78,088.7 | 104,151.1 |
| Revenue Growth, % | 0 | -29.83 | 266.96 | -15.12 | 78.45 | 33.38 | 33.38 | 33.38 | 33.38 | 33.38 |
| EBITDA | 721.1 | 762.3 | 1,746.8 | 1,642.3 | 2,601.7 | 4,062.2 | 5,417.9 | 7,226.2 | 9,637.9 | 12,854.6 |
| EBITDA, % | 11.4 | 17.17 | 10.72 | 11.88 | 10.54 | 12.34 | 12.34 | 12.34 | 12.34 | 12.34 |
| Depreciation | 52.9 | 56.5 | 68.9 | 135.4 | 325.6 | 317.9 | 424.1 | 565.6 | 754.4 | 1,006.1 |
| Depreciation, % | 0.83623 | 1.27 | 0.42294 | 0.97928 | 1.32 | 0.96603 | 0.96603 | 0.96603 | 0.96603 | 0.96603 |
| EBIT | 668.2 | 705.9 | 1,677.9 | 1,506.9 | 2,276.1 | 3,744.2 | 4,993.8 | 6,660.6 | 8,883.6 | 11,848.5 |
| EBIT, % | 10.56 | 15.9 | 10.3 | 10.9 | 9.22 | 11.38 | 11.38 | 11.38 | 11.38 | 11.38 |
| Total Cash | 172.5 | 287.4 | 346.2 | 647.8 | 3,118.1 | 1,885.5 | 2,514.8 | 3,354.2 | 4,473.7 | 5,966.8 |
| Total Cash, percent | .0 | .0 | .0 | .0 | .0 | .0 | .0 | .0 | .0 | .0 |
| Account Receivables | 962.4 | 1,164.3 | 2,812.4 | 3,450.8 | 8,281.8 | 7,715.7 | 10,290.8 | 13,725.4 | 18,306.3 | 24,416.0 |
| Account Receivables, % | 15.21 | 26.22 | 17.26 | 24.95 | 33.56 | 23.44 | 23.44 | 23.44 | 23.44 | 23.44 |
| Inventories | 54.9 | 74.6 | 108.1 | 72.3 | 74.1 | 265.7 | 354.3 | 472.6 | 630.3 | 840.7 |
| Inventories, % | 0.8672 | 1.68 | 0.66378 | 0.52293 | 0.30048 | 0.80716 | 0.80716 | 0.80716 | 0.80716 | 0.80716 |
| Accounts Payable | 1,003.8 | 772.5 | 1,925.9 | 543.3 | 1,717.3 | 3,684.7 | 4,914.5 | 6,554.7 | 8,742.4 | 11,660.2 |
| Accounts Payable, % | 15.87 | 17.4 | 11.82 | 3.93 | 6.96 | 11.2 | 11.2 | 11.2 | 11.2 | 11.2 |
| Capital Expenditure | -60.0 | -64.1 | -719.9 | -455.5 | -2,100.8 | -1,225.6 | -1,634.6 | -2,180.2 | -2,907.8 | -3,878.3 |
| Capital Expenditure, % | -0.94814 | -1.44 | -4.42 | -3.29 | -8.51 | -3.72 | -3.72 | -3.72 | -3.72 | -3.72 |
| Tax Rate, % | 20.58 | 20.58 | 20.58 | 20.58 | 20.58 | 20.58 | 20.58 | 20.58 | 20.58 | 20.58 |
| EBITAT | 472.9 | 525.4 | 1,245.2 | 1,165.8 | 1,807.7 | 2,817.2 | 3,757.5 | 5,011.5 | 6,684.2 | 8,915.0 |
| Depreciation | ||||||||||
| Changes in Account Receivables | ||||||||||
| Changes in Inventories | ||||||||||
| Changes in Accounts Payable | ||||||||||
| Capital Expenditure | ||||||||||
| UFCF | 452.4 | 64.8 | 65.9 | -1,139.3 | -3,626.4 | 4,251.7 | 1,112.9 | 1,484.3 | 1,979.7 | 2,640.5 |
| WACC, % | 14.8 | 14.82 | 14.82 | 14.84 | 14.85 | 14.82 | 14.82 | 14.82 | 14.82 | 14.82 |
| PV UFCF | ||||||||||
| SUM PV UFCF | 7,989.0 | |||||||||
| Long Term Growth Rate, % | 2.00 | |||||||||
| Free cash flow (T + 1) | 2,693 | |||||||||
| Terminal Value | 21,001 | |||||||||
| Present Terminal Value | 10,521 | |||||||||
| Enterprise Value | 18,510 | |||||||||
| Net Debt | 44 | |||||||||
| Equity Value | 18,466 | |||||||||
| Diluted Shares Outstanding, MM | 128 | |||||||||
| Equity Value Per Share | 143.98 |
Benefits You Will Receive
- Adjustable Forecast Parameters: Effortlessly modify key assumptions (growth %, margins, WACC) to explore various scenarios.
- Real-Time Financial Data: Refex Industries Limited’s (REFEXNS) financial information is pre-loaded to facilitate your analysis.
- Instant DCF Calculations: The model automatically computes Net Present Value (NPV) and intrinsic value for your convenience.
- Customizable and Professional Design: A refined Excel template tailored to meet your valuation preferences.
- Designed for Analysts and Investors: Perfect for testing forecasts, validating strategies, and enhancing efficiency.
Key Features
- Pre-Loaded Data: Refex Industries Limited’s historical financial statements and pre-filled forecasts.
- Fully Adjustable Inputs: Modify WACC, tax rates, revenue growth, and EBITDA margins as needed.
- Instant Results: Monitor Refex Industries Limited’s intrinsic value recalculating in real time.
- Clear Visual Outputs: Dashboard charts present valuation results and essential metrics.
- Built for Accuracy: A professional-grade tool designed for analysts, investors, and finance professionals.
How It Works
- Step 1: Download the Excel file for Refex Industries Limited (REFEXNS).
- Step 2: Review the pre-filled financial data and forecasts for Refex Industries.
- Step 3: Adjust key inputs such as revenue growth, WACC, and tax rates (highlighted cells).
- Step 4: Observe the DCF model update in real-time as you modify your assumptions.
- Step 5: Evaluate the results and leverage the insights for your investment decisions.
Why Opt for This Calculator?
- Designed for Experts: A sophisticated tool tailored for analysts, CFOs, and industry consultants.
- Accurate Data Insights: REFEXNS’s historical and projected financials are preloaded for precision.
- Forecast Scenarios: Effortlessly simulate various assumptions and projections.
- Concise Results: Automatically determines intrinsic value, NPV, and key performance indicators.
- User-Friendly: Step-by-step guidance makes the process straightforward.
Who Can Benefit from This Product?
- Professional Investors: Develop comprehensive and accurate valuation models for effective portfolio management.
- Corporate Finance Teams: Examine valuation scenarios to inform and optimize internal business strategies.
- Consultants and Advisors: Deliver precise valuation insights for Refex Industries Limited (REFEXNS) to your clients.
- Students and Educators: Utilize real-world data to enhance learning and practice in financial modeling.
- Industry Enthusiasts: Gain insights into the market valuation of companies like Refex Industries Limited (REFEXNS).
Contents of the Template
- Preloaded REFEXNS Data: Historical and projected financial information, including revenue, EBIT, and capital expenditures.
- DCF and WACC Models: High-quality spreadsheets designed for calculating intrinsic value and Weighted Average Cost of Capital.
- Editable Inputs: Cells highlighted in yellow for modifying revenue growth, tax rates, and discount rates.
- Financial Statements: Detailed annual and quarterly financial statements for comprehensive analysis.
- Key Ratios: Metrics on profitability, leverage, and efficiency to assess performance.
- Dashboard and Charts: Visual representations of valuation results and underlying assumptions.
Disclaimer
All information, articles, and product details provided on this website are for general informational and educational purposes only. We do not claim any ownership over, nor do we intend to infringe upon, any trademarks, copyrights, logos, brand names, or other intellectual property mentioned or depicted on this site. Such intellectual property remains the property of its respective owners, and any references here are made solely for identification or informational purposes, without implying any affiliation, endorsement, or partnership.
We make no representations or warranties, express or implied, regarding the accuracy, completeness, or suitability of any content or products presented. Nothing on this website should be construed as legal, tax, investment, financial, medical, or other professional advice. In addition, no part of this site—including articles or product references—constitutes a solicitation, recommendation, endorsement, advertisement, or offer to buy or sell any securities, franchises, or other financial instruments, particularly in jurisdictions where such activity would be unlawful.
All content is of a general nature and may not address the specific circumstances of any individual or entity. It is not a substitute for professional advice or services. Any actions you take based on the information provided here are strictly at your own risk. You accept full responsibility for any decisions or outcomes arising from your use of this website and agree to release us from any liability in connection with your use of, or reliance upon, the content or products found herein.