
|
Richardson Electronics, Ltd. (RELL): 5 FORCES Analysis [Nov-2025 Updated] |
Fully Editable: Tailor To Your Needs In Excel Or Sheets
Professional Design: Trusted, Industry-Standard Templates
Investor-Approved Valuation Models
MAC/PC Compatible, Fully Unlocked
No Expertise Is Needed; Easy To Follow
Richardson Electronics, Ltd. (RELL) Bundle
You're looking at Richardson Electronics, Ltd. (RELL) right after they shed their Healthcare business in January 2025, and the results from Q1 FY2026, ending August 30, 2025, are telling. While consolidated revenue only nudged up to $54.6 million-a mere 1.6% bump year-over-year-the story is in the margin: net income more than tripled to $1.9 million, pushing the gross margin to 31.0%. This financial pivot confirms the strategy of focusing on niche, higher-barrier segments like Green Energy Solutions is working, but it also sets up a fascinating competitive landscape. Before diving into the details, let's map out the five forces that will define whether this profitability trend is sustainable against suppliers, customers, rivals, substitutes, and potential new players.
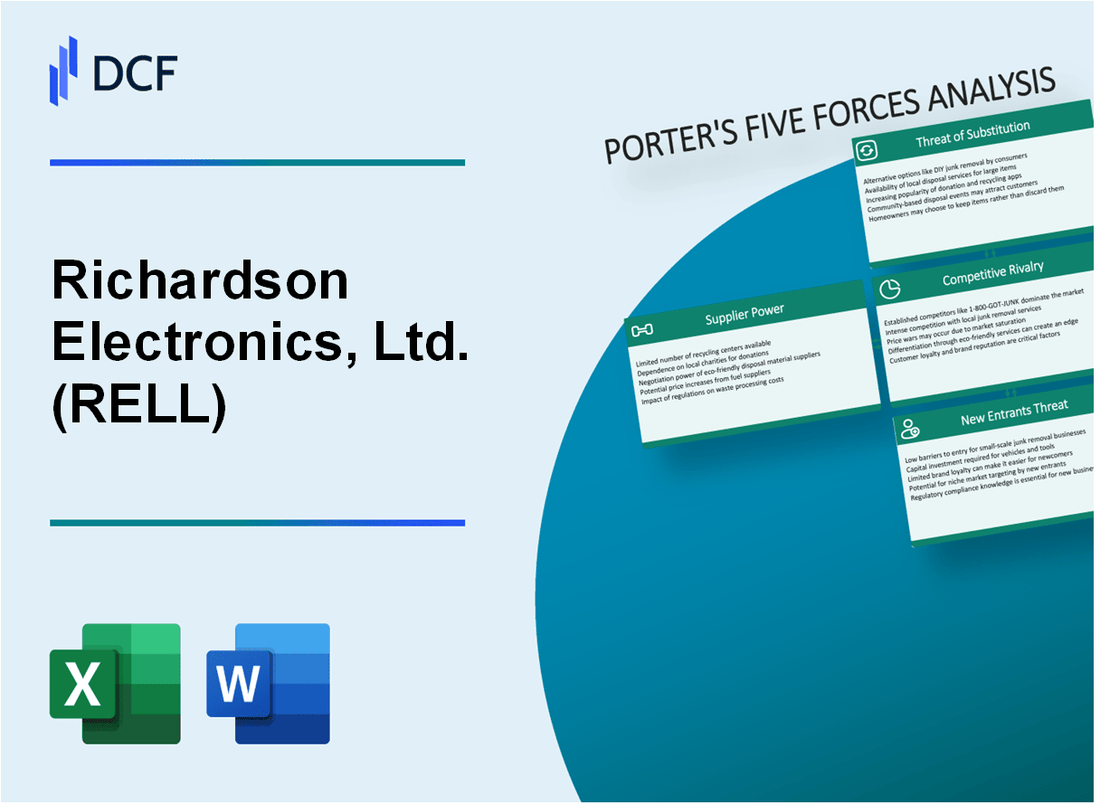
Richardson Electronics, Ltd. (RELL) - Porter's Five Forces: Bargaining power of suppliers
Suppliers of specialized electron tubes and components for Richardson Electronics, Ltd. (RELL) hold a moderate level of bargaining power. This power is tempered by RELL's own significant internal capabilities, but it remains a factor, especially for unique, high-tech inputs.
The leverage these external suppliers have is directly constrained by how much Richardson Electronics, Ltd. (RELL) controls its own production pipeline. You see, over 55% of the products sold by Richardson Electronics, Ltd. are manufactured either in-house across their facilities in LaFox, Illinois, Marlborough, Massachusetts, or Donaueschingen, Germany, or by their dedicated manufacturing partners. These partners operate under very specific constraints.
Here's a quick look at the structure that influences supplier power:
| Metric | Value/Detail | Source Context (FY2025/Late 2025) |
|---|---|---|
| In-House/Partner Manufactured Products | 55% | Manufactured in US/Germany facilities or by partners to strict specifications. |
| Expected Raw Material Price Increase (2025) | 3% | On top of a 3% increase in 2024, per ISM panelists. |
| Short-Run Price Level Rise from 2025 Tariffs | 1.8% | Estimated impact from tariffs implemented through August 6, 2025. |
| Partner Manufacturing Specification Adherence | Strict Specifications/Supplier Code of Conduct | All partners manufacture to RELL's requirements. |
Geopolitical risks and the ongoing push for supply chain resilience definitely increase material cost volatility for Richardson Electronics, Ltd. For instance, manufacturers faced an expected 3% increase in prices paid for raw materials during 2025, following a similar 3% rise in 2024. Also, specific events, like China's ban on critical mineral exports in 2025, signal potential disruption across the tech supply chain. Furthermore, new US tariffs implemented in 2025 were estimated to cause a short-run price level rise of 1.8%. These external pressures mean that even with internal manufacturing strength, the cost of sourced components can fluctuate.
Richardson Electronics, Ltd.'s historical role as a distributor for third-party products means reliance on key technology partners is still present in certain segments. The company notes its technology partner relationships are extremely strong, and they collaborate on new component development and strategic purchases. This collaborative model helps Richardson Electronics, Ltd. capture more revenue by adding value through design-in support and systems integration, rather than just moving boxes.
Richardson Electronics, Ltd. (RELL) - Porter's Five Forces: Bargaining power of customers
You're looking at Richardson Electronics, Ltd. (RELL) and trying to figure out how much sway its buyers really have. It's a mixed bag, honestly. On one hand, the sheer volume of customers suggests low individual power, but on the other, the nature of the Green Energy Solutions (GES) business means a few big wins or losses can swing a quarter.
The customer base for Richardson Electronics, Ltd. is definitely broad, which usually dilutes buyer power. We are talking about more than 20,000 OEM and end-user customers globally across all their segments. That fragmentation is a buffer. However, the power dynamic shifts dramatically when you look at the Green Energy Solutions group, where sales are concentrated.
For example, in late 2024, Richardson Electronics, Ltd. secured two multi-million dollar production contracts expected to ship throughout calendar year 2025 with two of the world's largest wind farm operators in North America. Plus, they announced a supply agreement with TransAlta Corporation for ULTRA3000® and ULTRAPEM™ modules, with shipments also expected in 2025. These large, project-based orders mean that while you have thousands of small customers, a handful of these major operators can definitely command attention and favorable terms, especially around delivery schedules.
The leverage these large customers have is somewhat countered by the high switching costs associated with specialized, proprietary engineered solutions like the ULTRA3000® Pitch Energy Module (PEM). This product is a patented, ultracapacitor-based, drop-in replacement for lead-acid batteries in specific wind turbine pitch systems. The value proposition itself creates stickiness. Here's the quick math on why switching away is tough:
| Feature | Data Point | Implication for Customer Switching |
|---|---|---|
| Estimated Lifetime | 15+ years | Long-term commitment reduces near-term need to re-evaluate alternatives. |
| Operational Modules in Field | 5000+ | Proven track record reduces perceived risk of the technology. |
| Trigger for Replacement | Typically after GE's warranty expires, usually two (2) years | Customers are locked in until the end of a defined service cycle. |
| Installation Effort | Eliminates need for wiring harness modifications or new brackets | Lowers labor costs and installation downtime, making the initial choice easier to stick with. |
Still, you have to watch the timing. The project-based nature of the GES segment means quarterly revenue is susceptible to key customer timing. For instance, Richardson Electronics, Ltd. noted that backlog in GES declined in Q1 FY2026 due to the timing of new orders, which can fluctuate quarter-to-quarter. This sensitivity shows that even with high switching costs for existing installations, the timing of new, large-scale adoption decisions by these major buyers directly impacts short-term financial reporting. For context, the full fiscal year 2025 revenue was $208.91 million, and the first quarter of fiscal 2026 (ending August 30, 2025) was $54.6 million.
The power of the customer is therefore concentrated in a few key areas:
- Securing large, multi-million dollar contracts for new deployments.
- Influencing the timing of large-scale retrofit orders.
- Demanding favorable terms based on volume commitment.
The overall customer base is large, but the most powerful buyers are those operating massive fleets of turbines where the ULTRA3000® is deployed.
Finance: draft 13-week cash view by Friday.
Richardson Electronics, Ltd. (RELL) - Porter's Five Forces: Competitive rivalry
You're looking at the competitive landscape for Richardson Electronics, Ltd. (RELL), and the rivalry force is definitely a mixed bag. It's not a straightforward fight across the board; instead, it's a complex dynamic shaped by niche specialization versus broad distribution.
Richardson Electronics, Ltd. operates in specific, high-barrier segments, like power grid tubes and semiconductor wafer fab components. In these areas, you won't find many direct, large-scale rivals capable of matching their deep engineering expertise. For instance, their Power and Microwave Technologies group represents over 75 years of legacy in this space, serving markets from alternative energy to scientific applications. Still, the company's overall valuation metrics suggest a competitive pricing structure.
Here's the quick math on that valuation point: Richardson Electronics, Ltd. has a Price-to-Sales ratio of 0.8x, which is notably below the US electronic industry average of 2.7x. What this estimate hides is the specific industry breakdown, but the implication is clear-investors are valuing the revenue stream at a discount relative to the broader sector.
The rivalry intensifies when Richardson Electronics, Ltd. competes in general electronic distribution against much larger firms like TD SYNNEX. These larger players have massive scale, which naturally puts pressure on margins in distribution-heavy areas. However, the company is actively shifting the focus to proprietary, higher-margin products to counter this pressure.
This strategic pivot is showing up in the financials. Look at the first quarter of fiscal 2026 (Q1 FY2026): the gross margin expanded to 31.0% of net sales, up from 30.6% in the prior year's first quarter. That margin expansion is directly supported by the strength in their specialized segments.
The semiconductor wafer fab business, for example, saw net sales surge by 52.2% year-over-year in Q1 FY2026, which is a huge driver for that better mix. The overall Q1 FY2026 net sales were $54.6 million, with operating income more than tripling to $1.0 million year-over-year.
We can map out where Richardson Electronics, Ltd. stands against some industry benchmarks for context, keeping in mind the required figures versus what the latest data suggests for the general electronics space.
| Metric | Richardson Electronics, Ltd. (Q1 FY2026/Recent) | Industry Benchmark (As of Jan 2025/Required) |
|---|---|---|
| Price-to-Sales Ratio | 0.8x (As required) / ~0.67x (Calculated from TTM Rev) | 2.7x (As required) / 2.27x (General Electronics Average) |
| Gross Margin | 31.0% (Q1 FY2026) | N/A (Varies widely) |
| Semiconductor Sales Growth | 52.2% YoY (Q1 FY2026) | N/A |
The competitive dynamic is best summarized by looking at the core business activities where they face different levels of rivalry:
- Niche component sales (e.g., power grid tubes) face fewer direct, large-scale rivals.
- Electronic distribution faces rivalry from much larger firms like TD SYNNEX.
- Growth in the semiconductor wafer fab business is a key counter-strategy.
- The focus on engineered solutions drives margin improvement to 31.0%.
If onboarding for new specialized designs takes longer than expected, the competitive advantage from engineering support could erode, so you'll want to watch the backlog conversion rates closely. Finance: draft 13-week cash view by Friday.
Richardson Electronics, Ltd. (RELL) - Porter's Five Forces: Threat of substitutes
You're looking at the threat of substitutes for Richardson Electronics, Ltd. (RELL), and the picture is nuanced; some product categories face direct, high-tech competition, while others benefit from the very nature of their specialized service offerings.
The Patented ultracapacitor technology (ULTRA3000®) is a prime example of successful substitution against a legacy component. This technology directly replaces high-maintenance lead-acid batteries in wind turbine pitch systems. As of May 2023, over 37,000 ULTRA3000® Pitch Energy Modules (PEMs) were installed, making it the top choice for GE owner/operators looking to reduce nuisance battery faults and boost turbine availability. This product is a direct, plug-and-play replacement for the batteries in GE 20 and 30 Nm pitch systems, which typically have a two-year warranty period. The success in this niche has been significant; the agreement with GE Vernova nearly doubled the served available market (SAM) in North America, which was estimated at $85M for GE turbines back in 2021. While the Green Energy Solutions (GES) segment saw a slight dip in Q1 FY2026 net sales of $0.8 million year-over-year due to the non-recurrence of a large EV Locomotive order, the wind segment within GES actually increased sales year-over-year for that same quarter ending August 30, 2025. The product's claimed 15-year lifetime further solidifies its advantage over the batteries it replaces.
On the other hand, the long-term threat from Gallium Nitride (GaN) and Silicon Carbide (SiC) power semiconductors is real for Richardson Electronics' traditional vacuum tube technology. These wide-bandgap semiconductors are driving efficiency and performance gains across many sectors. The broader GaN and SiC market is expanding rapidly, projected to grow from $1.42 billion in 2024 to $1.68 billion in 2025, a compound annual growth rate (CAGR) of 18.2%. Richardson Electronics is clearly capitalizing on this trend, as evidenced by the 52.2% year-over-year increase in semiconductor wafer fab net sales in Q1 FY2026. Management even anticipated this segment returning to annual sales exceeding $40 million in calendar year 2025. Still, the company's ability to integrate these newer technologies, like through its partnership with Navitas Semiconductor mentioned in past updates, helps mitigate the substitution threat by keeping its Power and Microwave Technologies Group (PMT) relevant.
The threat of substitution for revenue derived from aftermarket service and system integration is noticeably lower. Richardson Electronics explicitly adds value through design-in support, system integration, and aftermarket technical service and repair. This high-touch, customized approach is inherently harder to substitute than a simple commodity component. For instance, the focus on high-value equipment repair, such as the CT tube repair program for diagnostic imaging equipment, provides a sticky revenue stream. While the Healthcare segment was consolidated into PMT after a majority asset sale in January 2025, its performance in Q1 FY2025 showed strong demand, with sales increasing by 48.7% year-over-year, indicating the value customers place on specialized service for complex, high-cost assets.
To put this in perspective against the company's overall size, Richardson Electronics reported annual revenue of $208.91M for the fiscal year ending May 31, 2025, with Q1 FY2026 sales at $54.6 million. The mix of high-value engineered solutions versus components is key to defending against substitution.
| Product/Service Area | Substitution Metric/Data Point | Value/Amount (as of late 2025 context) |
|---|---|---|
| ULTRA3000® Wind Turbine Modules | Number of PEMs Installed (as of May 2023) | Over 37,000 units |
| ULTRA3000® Wind Turbine Modules | Estimated North America SAM (for GE pitch systems, 2021) | $85M |
| GaN/SiC Power Semiconductor Market | Market Size Growth (2024 to 2025) | From $1.42B to $1.68B |
| RELL Semiconductor Wafer Fab Sales | Year-over-Year Growth (Q1 FY2026) | 52.2% |
| RELL Total Annual Revenue (FY2025) | Total Revenue | $208.91M |
| RELL Q1 FY2026 Net Sales (Ended Aug 30, 2025) | Total Net Sales | $54.6 million |
The core defense against substitution lies in the complexity and integration of their offerings. You can see the difference when you compare the component-like sales to the service-heavy ones:
- ULTRA3000® lifetime is 15 years, reducing replacement frequency.
- GES segment sales grew 84% YoY in Q1 FY2025 on modules.
- Richardson Electronics manufactures approximately 50% of its sold products.
- Aftermarket service reduces substitution threat for service revenue.
The company's strategy seems to be using superior technology like ULTRA3000® to substitute older tech, while simultaneously embedding itself deeper into customer operations via system integration, making the entire solution hard to replace. Finance: review Q2 FY2026 backlog breakdown by segment by next Tuesday.
Richardson Electronics, Ltd. (RELL) - Porter's Five Forces: Threat of new entrants
High capital intensity and specialized manufacturing for products like power grid tubes create substantial barriers to entry. Richardson Electronics, Ltd. has been supplying power grid tubes to the induction and dielectric heating industries since 1947. More than 55% of Richardson Electronics, Ltd.'s products are manufactured in LaFox, Illinois, Marlborough, Massachusetts, or Donaueschingen, Germany, or by manufacturing partners adhering to strict specifications.
The need for a global infrastructure, with the company citing 60+ locations in 24 countries, deters smaller entrants from matching the established support network.
| Region | Key Location/Entity | Certification Status |
| North America | LaFox, IL (Corporate HQ) | ISO 9001:2015 Certified |
| Europe | Donaueschingen, Germany (Canvys) | ISO 13485:2016 Certified |
| Europe | Marlborough, MA (Canvys) | ISO 13485:2016 Certified |
| Asia | Beijing, China | Sales Representative Location |
The company's adherence to stringent quality standards, evidenced by its certifications, represents a significant hurdle for newcomers to replicate quickly.
- ISO 9001:2015 Certification (LaFox, IL)
- ISO 13485:2016 Certification (Canvys facilities)
- ISO 13485:2016 awarded in 2018
The strategic asset sale of the Healthcare division in January 2025 allows Richardson Electronics, Ltd. to focus resources on higher-barrier Green Energy Solutions (GES). Richardson Electronics, Ltd. sold a majority of its Richardson Healthcare reportable segment to DirectMed Imaging on January 24, 2025, for $8.2 million. The company maintains strong liquidity, reporting $35.7 million in cash and cash equivalents as of August 31, 2025.
Disclaimer
All information, articles, and product details provided on this website are for general informational and educational purposes only. We do not claim any ownership over, nor do we intend to infringe upon, any trademarks, copyrights, logos, brand names, or other intellectual property mentioned or depicted on this site. Such intellectual property remains the property of its respective owners, and any references here are made solely for identification or informational purposes, without implying any affiliation, endorsement, or partnership.
We make no representations or warranties, express or implied, regarding the accuracy, completeness, or suitability of any content or products presented. Nothing on this website should be construed as legal, tax, investment, financial, medical, or other professional advice. In addition, no part of this site—including articles or product references—constitutes a solicitation, recommendation, endorsement, advertisement, or offer to buy or sell any securities, franchises, or other financial instruments, particularly in jurisdictions where such activity would be unlawful.
All content is of a general nature and may not address the specific circumstances of any individual or entity. It is not a substitute for professional advice or services. Any actions you take based on the information provided here are strictly at your own risk. You accept full responsibility for any decisions or outcomes arising from your use of this website and agree to release us from any liability in connection with your use of, or reliance upon, the content or products found herein.