
|
Shree Renuka Sugars Limited (RENUKA.NS) DCF Valuation |
Fully Editable: Tailor To Your Needs In Excel Or Sheets
Professional Design: Trusted, Industry-Standard Templates
Investor-Approved Valuation Models
MAC/PC Compatible, Fully Unlocked
No Expertise Is Needed; Easy To Follow
Shree Renuka Sugars Limited (RENUKA.NS) Bundle
Enhance your investment strategies with the Shree Renuka Sugars Limited (RENUKANS) DCF Calculator! Review authentic financial data, adjust growth projections and expenses, and instantly observe how these changes affect the intrinsic value of Shree Renuka Sugars Limited (RENUKANS).
What You Will Receive
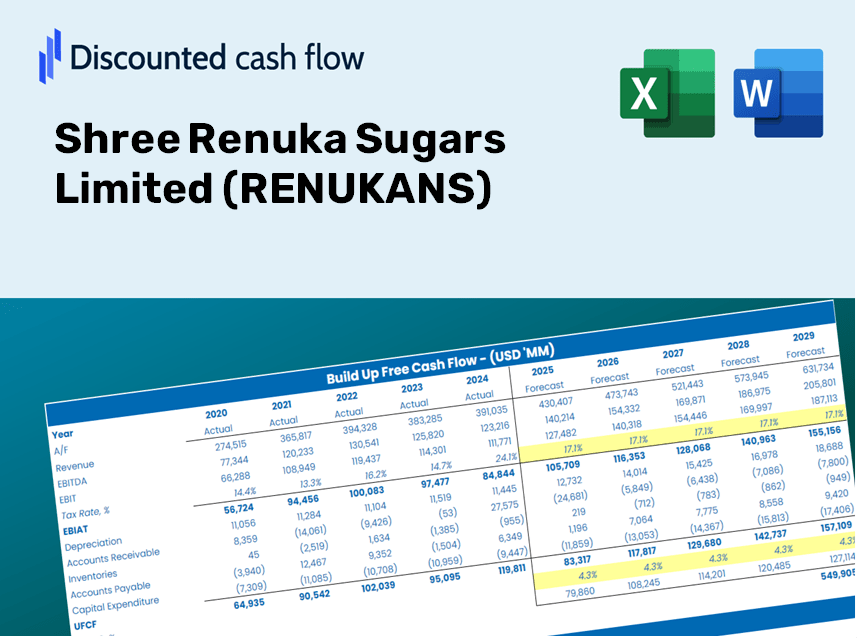
- Authentic Shree Renuka Data: Comprehensive financials – covering everything from revenue to EBIT – derived from actual and projected statistics.
- Complete Customization: Modify all essential parameters (yellow cells) such as WACC, growth percentage, and tax rates.
- Immediate Valuation Updates: Automatic recalculations to assess the effects of changes on Shree Renuka’s fair value.
- Flexible Excel Template: Designed for quick adjustments, scenario analysis, and thorough projections.
- Efficient and Accurate: Eliminate the need to build models from scratch while ensuring accuracy and adaptability.
Key Features
- Authentic Financial Data for Shree Renuka Sugars: Gain access to precise pre-loaded historical data and future forecasts.
- Adjustable Forecast Inputs: Modify highlighted cells such as WACC, growth rates, and profit margins.
- Real-Time Calculations: Automated updates for DCF, Net Present Value (NPV), and cash flow assessments.
- User-Friendly Dashboard: Clear charts and summaries for effective visualization of your valuation outcomes.
- Suitable for All Skill Levels: An intuitive design tailored for investors, CFOs, and consultants alike.
How It Works
- Download: Obtain the pre-configured Excel file containing Shree Renuka Sugars Limited (RENUKANS) financial data.
- Customize: Modify forecasts such as revenue growth, EBITDA %, and WACC to fit your analysis.
- Update Automatically: Enjoy real-time updates on intrinsic value and NPV calculations as you make adjustments.
- Test Scenarios: Develop various projections and instantly assess different outcomes.
- Make Decisions: Leverage the valuation findings to inform your investment strategy for Shree Renuka Sugars Limited (RENUKANS).
Why Choose This Calculator for Shree Renuka Sugars Limited (RENUKANS)?
- Reliable Data: Utilize authentic financial figures from Shree Renuka Sugars for trustworthy valuation outcomes.
- Tailored Options: Modify key variables such as growth projections, WACC, and tax rates to align with your forecasts.
- Efficiency Boost: Pre-configured calculations save you the hassle of starting from the ground up.
- Professional Quality: Crafted for use by investors, analysts, and consultants in the field.
- User-Centric: An intuitive design coupled with clear, step-by-step guidance ensures accessibility for all users.
Who Can Benefit from This Product?
- Investors: Accurately evaluate the fair value of Shree Renuka Sugars Limited (RENUKANS) prior to making investment choices.
- CFOs: Utilize a professional-quality DCF model for comprehensive financial reporting and analysis.
- Consultants: Efficiently modify the template for client valuation reports.
- Entrepreneurs: Acquire insights into financial modeling practices employed by leading companies.
- Educators: Employ this resource as a teaching aid to illustrate valuation techniques.
Contents of the Template
- In-Depth DCF Model: Editable framework featuring comprehensive valuation calculations.
- Actual Data: Shree Renuka Sugars Limited's (RENUKANS) historical and projected financials preloaded for evaluation.
- Adjustable Variables: Modify WACC, growth rates, and tax assumptions to explore various scenarios.
- Detailed Financial Statements: Complete annual and quarterly breakdowns for enhanced analysis.
- Essential Ratios: Integrated analysis for profitability, efficiency, and leverage metrics.
- Visual Dashboard Outputs: Charts and tables presenting clear, actionable insights.
Disclaimer
All information, articles, and product details provided on this website are for general informational and educational purposes only. We do not claim any ownership over, nor do we intend to infringe upon, any trademarks, copyrights, logos, brand names, or other intellectual property mentioned or depicted on this site. Such intellectual property remains the property of its respective owners, and any references here are made solely for identification or informational purposes, without implying any affiliation, endorsement, or partnership.
We make no representations or warranties, express or implied, regarding the accuracy, completeness, or suitability of any content or products presented. Nothing on this website should be construed as legal, tax, investment, financial, medical, or other professional advice. In addition, no part of this site—including articles or product references—constitutes a solicitation, recommendation, endorsement, advertisement, or offer to buy or sell any securities, franchises, or other financial instruments, particularly in jurisdictions where such activity would be unlawful.
All content is of a general nature and may not address the specific circumstances of any individual or entity. It is not a substitute for professional advice or services. Any actions you take based on the information provided here are strictly at your own risk. You accept full responsibility for any decisions or outcomes arising from your use of this website and agree to release us from any liability in connection with your use of, or reliance upon, the content or products found herein.