
|
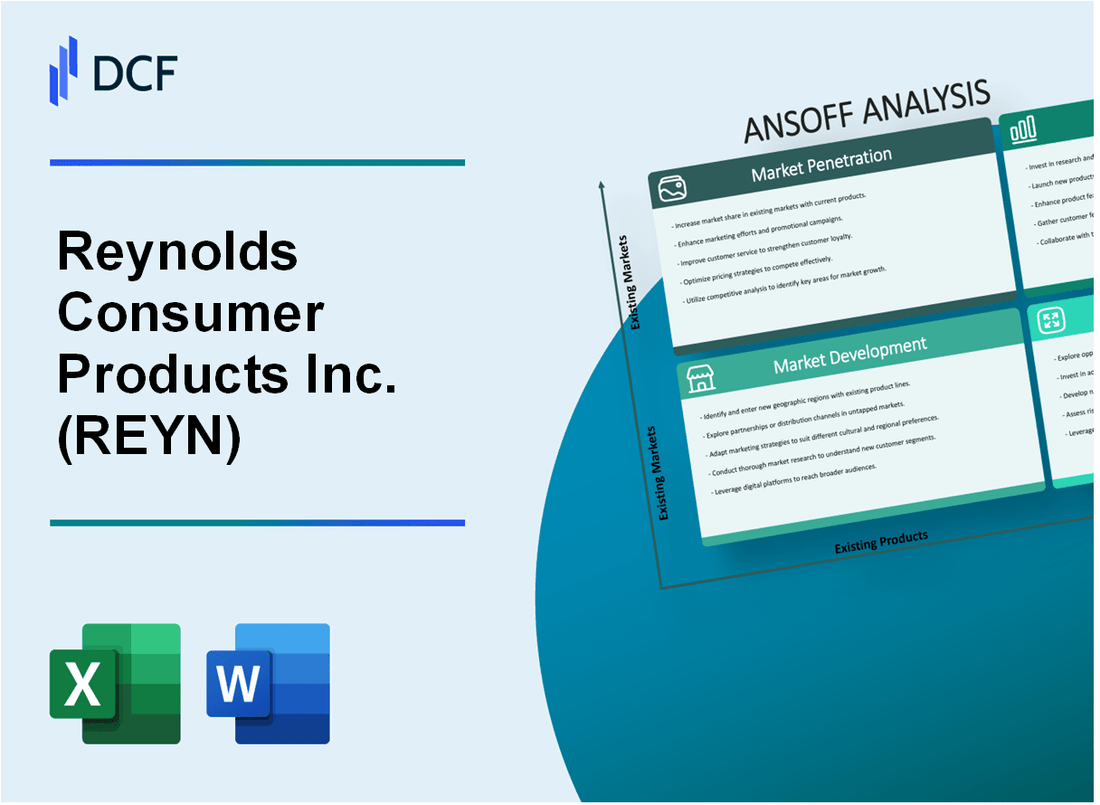
Reynolds Consumer Products Inc. (REYN): ANSOFF MATRIX [Apr-2026 Updated] |
Fully Editable: Tailor To Your Needs In Excel Or Sheets
Professional Design: Trusted, Industry-Standard Templates
Investor-Approved Valuation Models
MAC/PC Compatible, Fully Unlocked
No Expertise Is Needed; Easy To Follow
Reynolds Consumer Products Inc. (REYN) Bundle
You're looking at Reynolds Consumer Products Inc.'s (REYN) playbook for 2025, and honestly, it's a masterclass in balancing defense with calculated offense. As an analyst who's seen a few cycles, I can tell you their strategy isn't just about keeping the lights on; it's about aggressive growth anchored by hitting that $\mathbf{\$655}$ million to $\mathbf{\$665}$ million Adjusted EBITDA target through smart pricing actions. They are defending their core with market penetration while simultaneously scaling new products like Reynolds Kitchens air fryer cups and exploring international moves, like expanding Reynolds Wrap into Canada or Mexico. This matrix lays out exactly how they plan to grow, from investing $\mathbf{\$30}$ million to $\mathbf{\$40}$ million in automation to eyeing adjacent B2B packaging markets. That's the whole game right there.
Reynolds Consumer Products Inc. (REYN) - Ansoff Matrix: Market Penetration
You're looking at how Reynolds Consumer Products Inc. (REYN) plans to squeeze more volume out of the markets where its established brands, like Hefty Waste Bags, already have a foothold. This is about maximizing penetration with what you already sell, right where you already sell it.
For core categories, the strategy involves driving volume through targeted efforts. Reynolds Consumer Products gained share in multiple categories, including Hefty Waste Bags and private label food bags, contributing to revenue growth in Q2 2025. In Q1 2025, the company noted it outperformed its categories by 2 points at retail and gained market share across household foil, waste bags, and food bags without increasing promotional spending. This suggests a focus on efficiency over simply increasing promotional activity, though optimizing that spend is always in play.
To protect the full-year financial goals, pricing is a key lever. Reynolds Consumer Products is implementing planned positive pricing actions expected to be in the range of 2 to 4 points for the full fiscal 2025 year. This is specifically aimed at offsetting cost headwinds, including those resulting from tariffs, and is critical to achieving the stated full-year Adjusted EBITDA target of $655 million to $665 million.
Distribution expansion continues to be a focus, building on recent success. The company highlighted its Q1 2025 performance where it outperformed categories by 2 points, which is a direct measure of successful shelf presence and retailer alignment. New leadership is specifically tasked with unlocking more distribution opportunities for the strong brand portfolio.
The near-term consumer environment demands flexibility in packaging and price. You have to react to the fact that U.S. consumer confidence dropped by 15 points in the first half of 2025. To capture value-seeking consumers amid this pressure, Reynolds Consumer Products is introducing varied pack sizes and new opening price points across its portfolio.
The digital shelf is also a growth area. The company is seeing strong adoption and growth in online sales across demographics. Market Penetration here means optimizing e-commerce retailer partnerships and digital marketing spend to capture this shifting behavior, which is a clear focus area for new commercial leadership.
Here's a snapshot of the recent financial context for these efforts:
| Metric | Q1 2025 Actual | Q2 2025 Actual | 2025 Full Year Target Range |
| Net Revenues (Millions USD) | $818 million | $938 million | Flat to down 1% vs. 2024 (based on Q3 update) |
| Adjusted EBITDA (Millions USD) | $117 million | $163 million | $655 million to $665 million |
| Category Outperformance (Points) | 2 points | N/A | N/A |
| Expected Positive Pricing (Points) | Partial impact in Q1 | N/A | 2 to 4 points |
The Q1 2025 Adjusted EBITDA came in at $117 million, reflecting lower volume and higher operational costs, partially offset by higher pricing and lower SG&A. By Q2 2025, Adjusted EBITDA improved to $163 million. The full-year outlook for Adjusted EBITDA remains targeted between $650 million and $670 million, with the specific goal being $655 million to $665 million.
You'll want to track the realization of that 2 to 4 point pricing recovery, as it's the primary mechanism to protect the margin target against input cost headwinds. Finance: draft the tracking dashboard for pricing realization vs. cost inflation by next Tuesday.
Reynolds Consumer Products Inc. (REYN) - Ansoff Matrix: Market Development
Focusing on Market Development means taking your current products, like Reynolds Wrap aluminum foil or Hefty storage solutions, and introducing them to new geographic markets or new customer segments within the existing market structure. For Reynolds Consumer Products Inc., this strategy hinges on expanding beyond the core U.S. retail base.
Targeting the Non-Retail/Industrial Segment for Aluminum Sales
You're looking to build momentum from the recent gains in the non-retail space, which serves food service and industrial customers, primarily with aluminum products. The trajectory shows clear growth potential in this area.
Here's a look at the non-retail revenue progression:
| Period | Non-Retail Revenue (Millions USD) |
| Q1 2025 | $51 million |
| Q3 2025 | $67 million |
| Full Year 2024 | $177 million |
The increase from Q1 2025 to Q3 2025 was $16 million, as Q3 2025 non-retail revenue of $67 million was an increase of $13 million over the prior year period's Q3 revenue. This segment, comprising aluminum sales to food service and industrial customers, represents a clear avenue for continued development, especially given the overall 2024 full-year non-retail revenue was $177 million.
Geographic Expansion: Canada and Mexico
Expanding the US-centric model north is a logical next step, using established brand equity where possible. Reynolds Consumer Products Inc. already has a physical footprint outside the US.
- Reynolds Consumer Products Inc. has one manufacturing facility and one warehouse in Canada.
- The Alcan® brand, part of the portfolio, is recognized as Canada's top foil brand.
Focusing initial efforts on non-perishable, high-demand items like Reynolds Wrap in Canada or Mexico allows for a lower-risk entry point before tackling more complex product lines.
Leveraging Acquisition Technology for International Reach
The acquisition of Atacama Manufacturing on November 6, 2023, brings materials development expertise focused on environmentally friendly products. This technology, which includes knowledge in recycled or renewable, plant-based materials, can be used to streamline supply chains for smaller, targeted international product rollouts.
The company has already seen success in sustainable product sales, which grew from $248 million in 2019 to $333 million in 2023. Applying this material science know-how to international expansion could offer a competitive edge, especially in markets with stricter environmental standards.
Dedicated Sales Channel for Institutional Markets
Penetrating the US institutional and food service market with the Hefty brand requires a dedicated approach, separate from the traditional retail channel. While the Hefty Tableware segment generated $757 million in revenue in 2018, the focus here is on the institutional side using existing tableware and storage products.
- The Hefty Waste & Storage segment holds the #1 U.S. market share in outdoor trash bags.
- The non-retail segment, which includes food service sales, posted $67 million in Q3 2025 revenue.
Developing a specific sales force or distribution partnership structure for this segment is the action required to convert existing brand recognition into institutional volume.
Pilot Direct-to-Consumer (DTC) Subscription Model
Capturing consumers outside the traditional retail shelf space can be achieved by piloting a DTC subscription for high-frequency items, such as Hefty trash bags. This bypasses the retailer relationship to build direct consumer data and recurring revenue streams.
The US trash bag market is estimated at $2.87 billion in 2024. A subscription model targets the residential sector, which holds the largest market share, by offering convenience for staple items.
The company's overall 2025 outlook projects net revenues to be flat to down 1% compared to 2024 net revenues of $3.7 billion, making new, incremental revenue streams like DTC critical.
Reynolds Consumer Products Inc. (REYN) - Ansoff Matrix: Product Development
You're looking at how Reynolds Consumer Products Inc. plans to grow by introducing new products into existing markets, which is the Product Development quadrant of the Ansoff Matrix. This strategy relies heavily on scaling successful recent innovations and funding the pipeline to support future launches, all while navigating a challenging macroeconomic environment.
The focus is on maximizing volume and share gains from recent product introductions. For example, Reynolds Kitchens air fryer cups and Hefty ECOSAVE compostable cutlery are explicitly mentioned as key innovations management is focused on scaling. This scaling effort is supported by the company's financial commitment to innovation. Reynolds Consumer Products Inc. is investing a planned $30 million to $40 million increase in capital spending for fiscal 2025, with a key focus on automation to support a faster innovation pipeline and drive margin improvements. This investment is set against a backdrop where fiscal 2025 Adjusted EBITDA is projected to be between $650 million and $670 million.
To illustrate the potential volume and revenue impact of successful product launches, consider the prior year's performance of scented waste bags. The Hefty Ultra Strong trash bags with Fabuloso scents achieved over $156 million in retail sales in 2023, representing an over 29% increase versus the prior year for that specific line. This success sets a benchmark for the current scaling efforts.
| Product Line | Size/Type | Reported MSRP (Example) | Prior Year Sales Context |
|---|---|---|---|
| Hefty Ultra Strong with Fabuloso Watermelon Scent | Tall Kitchen Bags (13 Gallon) | $9.49 | Part of a line achieving over $156 million in 2023 retail sales. |
| Hefty Ultra Strong with Fabuloso Watermelon Scent | Large Trash Bags (30 Gallon) | $9.49 | Part of a line achieving over 29% year-over-year growth in 2023. |
| Hefty Ultra Strong with Fabuloso Watermelon Scent | Medium Trash Bags (8 Gallon) | $4.99 | Innovation scaling supported by a $30 million to $40 million planned capital spending increase in 2025. |
| Hefty Ultra Strong with Fabuloso Watermelon Scent | Small Trash Bags (4 Gallon) | $4.99 | Overall fiscal 2025 Adjusted EBITDA guidance is $650 million to $670 million. |
The strategy includes introducing new, unique scents for Hefty Ultra Strong trash bags, building on the success of the Fabuloso Watermelon scent collaboration. This collaboration resulted in a line that included a vibrant pink bag option, which was the Hefty brand's first-ever pink trash bag, aiming to add a fun, stylish element to a routine purchase.
For the cooking segment, the plan involves developing a premium line of Reynolds Wrap foil with enhanced features, such as non-stick or extra heavy-duty capabilities. This move is designed to capture higher margins within the cooking segment, supporting the company's broader goal of margin expansion, which is a key focus for the 2025 capital investments.
Under the Presto brand, the development focus is on creating new food storage solutions that directly address specific consumer trends. This means creating products tailored for needs like meal prepping or accommodating specialty diet requirements. The Presto Products segment already plays a role by primarily selling store brand products across four main categories:
- Food storage bags
- Trash bags
- Reusable storage containers
- Plastic wrap
Reynolds Consumer Products Inc. (REYN) - Ansoff Matrix: Diversification
You're looking at where Reynolds Consumer Products Inc. can place its bets outside of its core, established markets. Diversification, in this context, means moving into new product/market combinations, which carries different risk and reward profiles than simply selling more trash bags or foil.
The current financial backdrop shows a company navigating some headwinds. For the first nine months of 2025, the TTM revenue ending September 30, 2025, stood at $\$3.709$ billion. The full-year 2025 outlook projects Net Revenues to be flat to down $1\%$ compared to the 2024 total of $\$3,695$ million. The company's market capitalization as of December 04, 2025, was $\$5.11$ billion. This scale gives you a sense of the capital base available for these new ventures.
Looking at the most recent reported quarter, Q3 2025, Net Revenues were $\$931$ million, with Adjusted EBITDA at $\$168$ million. The Hefty Tableware segment specifically faced challenges, with its volume decline attributed partly to a $3$-point headwind from foam products. This decline in a core area definitely makes exploring adjacent or new product spaces more urgent.
Here's a look at the current business structure based on recent reporting:
| Segment | Q3 2025 Net Revenues (Implied from context) | Key 2025 Financial Note |
| Reynolds Cooking & Baking | Largest segment historically | Saw a slight revenue increase in Q1 2025. |
| Hefty Waste & Storage | Significant contributor | Experienced a revenue rise in Q1 2025 despite lower Adjusted EBITDA. |
| Hefty Tableware | Facing category pressure | Declines in revenue and Adjusted EBITDA due to reduced foam volume. |
| Presto Products | Primarily store brand sales | Retail volume grew $9\%$ in Q3 2025 for its portfolio. |
| Non-Retail (B2B Aluminum) | Adjacent to Cooking & Baking | Generated $\$51$ million in Q2 2025, up $\$12$ million. |
The full-year 2025 Adjusted EBITDA guidance is set between $\$650$ million and $\$670$ million, compared to 2024's $\$678$ million. Any successful diversification move would need to move the needle beyond this range to justify the investment.
The proposed diversification moves are:
- Acquire a small, innovative US-based company in the sustainable home goods space, moving beyond disposable products into reusable kitchenware.
- Leverage the company's material science expertise to enter the adjacent B2B packaging market with custom, sustainable film or foil solutions.
- Launch a line of branded cleaning or home organization products, capitalizing on the strong Hefty brand equity and existing retail relationships.
- Explore a joint venture to develop compostable or biodegradable alternatives for the declining foam plate category, shifting the Hefty Tableware focus.
- Invest in onshoring production for new, smaller, high-demand product categories to mitigate tariff risks and create a new, nimble supply chain advantage.
The company has set an ESG goal to use recyclable or reusable packaging for all branded products by the end of 2025. This existing commitment provides a strong internal mandate for the sustainable product development aspects of diversification.
For instance, the Hefty Waste & Storage segment already offers compostable bags and bags made from recycled materials. Expanding this focus into reusable kitchenware or B2B films leverages existing material knowledge, which is key when the company is already working with partners like The New Norm (TNN) to recycle materials. That's a smart way to start. Finance: draft 13-week cash view by Friday.
Disclaimer
All information, articles, and product details provided on this website are for general informational and educational purposes only. We do not claim any ownership over, nor do we intend to infringe upon, any trademarks, copyrights, logos, brand names, or other intellectual property mentioned or depicted on this site. Such intellectual property remains the property of its respective owners, and any references here are made solely for identification or informational purposes, without implying any affiliation, endorsement, or partnership.
We make no representations or warranties, express or implied, regarding the accuracy, completeness, or suitability of any content or products presented. Nothing on this website should be construed as legal, tax, investment, financial, medical, or other professional advice. In addition, no part of this site—including articles or product references—constitutes a solicitation, recommendation, endorsement, advertisement, or offer to buy or sell any securities, franchises, or other financial instruments, particularly in jurisdictions where such activity would be unlawful.
All content is of a general nature and may not address the specific circumstances of any individual or entity. It is not a substitute for professional advice or services. Any actions you take based on the information provided here are strictly at your own risk. You accept full responsibility for any decisions or outcomes arising from your use of this website and agree to release us from any liability in connection with your use of, or reliance upon, the content or products found herein.