
|
Rafael Holdings, Inc. (RFL) DCF Valuation |
Fully Editable: Tailor To Your Needs In Excel Or Sheets
Professional Design: Trusted, Industry-Standard Templates
Investor-Approved Valuation Models
MAC/PC Compatible, Fully Unlocked
No Expertise Is Needed; Easy To Follow
Rafael Holdings, Inc. (RFL) Bundle
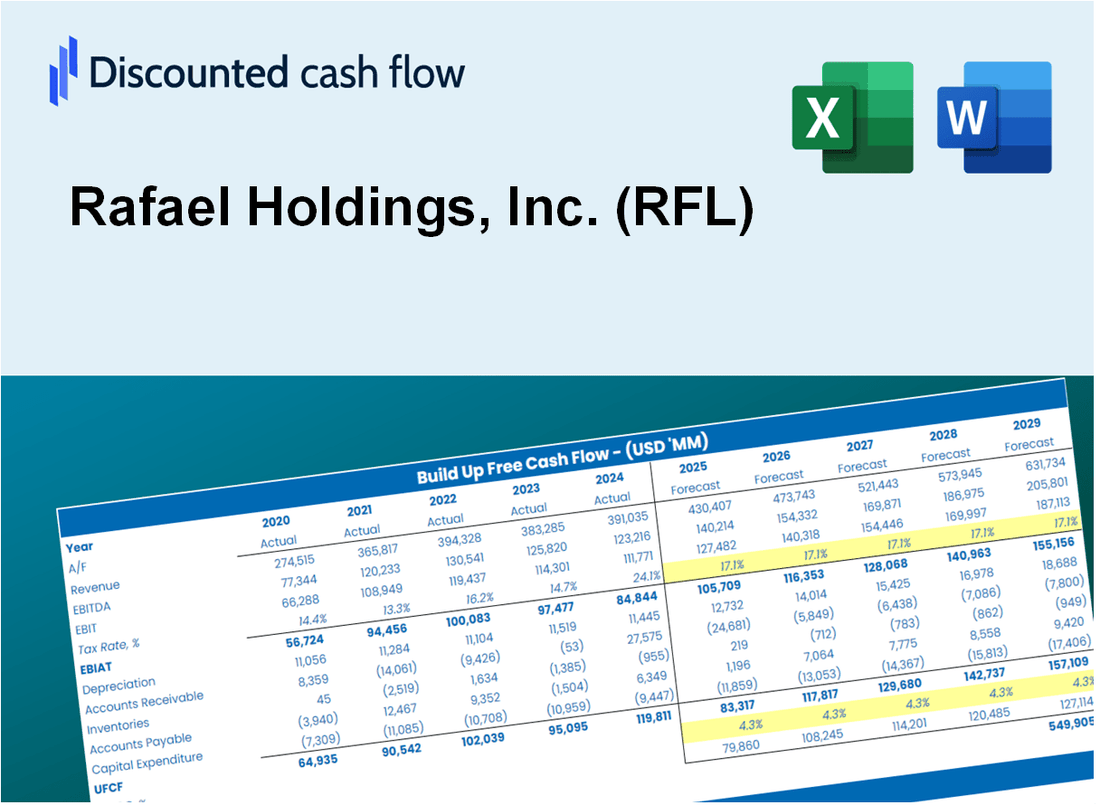
Make more informed investment choices with the Rafael Holdings, Inc. (RFL) DCF Calculator! Explore real Rafael financials, adjust growth projections and expenses, and instantly observe how these changes affect the intrinsic value of Rafael Holdings, Inc. (RFL).
Discounted Cash Flow (DCF) - (USD MM)
| Year | AY1 2021 |
AY2 2022 |
AY3 2023 |
AY4 2024 |
AY5 2025 |
FY1 2026 |
FY2 2027 |
FY3 2028 |
FY4 2029 |
FY5 2030 |
|---|---|---|---|---|---|---|---|---|---|---|
| Revenue | 4.0 | .4 | .3 | .6 | .9 | 1.0 | 1.0 | 1.1 | 1.1 | 1.2 |
| Revenue Growth, % | 0 | -89.68 | -31.95 | 128.32 | 43.96 | 5.58 | 5.58 | 5.58 | 5.58 | 5.58 |
| EBITDA | -23.3 | -139.9 | -8.7 | -66.8 | -32.3 | -1.0 | -1.0 | -1.1 | -1.1 | -1.2 |
| EBITDA, % | -587.86 | -34120.49 | -3106.45 | -10484.77 | -3516.9 | -100 | -100 | -100 | -100 | -100 |
| Depreciation | .1 | .1 | .1 | .2 | .3 | .2 | .2 | .2 | .3 | .3 |
| Depreciation, % | 1.76 | 17.56 | 27.96 | 35.32 | 31.41 | 22.8 | 22.8 | 22.8 | 22.8 | 22.8 |
| EBIT | -23.4 | -140.0 | -8.7 | -67.0 | -32.5 | -1.0 | -1.0 | -1.1 | -1.1 | -1.2 |
| EBIT, % | -589.62 | -34138.05 | -3134.41 | -10520.09 | -3548.31 | -100 | -100 | -100 | -100 | -100 |
| Total Cash | 7.9 | 63.2 | 79.5 | 65.9 | 52.8 | 1.0 | 1.0 | 1.1 | 1.1 | 1.2 |
| Total Cash, percent | .0 | .0 | .0 | .0 | .0 | .0 | .0 | .0 | .0 | .0 |
| Account Receivables | .8 | .3 | 2.5 | 6.1 | 1.8 | .8 | .8 | .8 | .9 | .9 |
| Account Receivables, % | 21.03 | 72.44 | 903.58 | 962.64 | 199.89 | 78.69 | 78.69 | 78.69 | 78.69 | 78.69 |
| Inventories | .0 | .0 | .0 | .0 | .3 | .1 | .1 | .1 | .1 | .1 |
| Inventories, % | 0 | 0 | 0 | 0 | 30.64 | 6.13 | 6.13 | 6.13 | 6.13 | 6.13 |
| Accounts Payable | 1.2 | .6 | .3 | 2.6 | 6.9 | .8 | .9 | .9 | 1.0 | 1.0 |
| Accounts Payable, % | 29.21 | 137.56 | 119.35 | 401.26 | 751.69 | 85.84 | 85.84 | 85.84 | 85.84 | 85.84 |
| Capital Expenditure | -.2 | .0 | 51.7 | -.1 | .0 | -.1 | -.1 | -.1 | -.1 | -.1 |
| Capital Expenditure, % | -5.19 | -0.4878 | 18522.94 | -22.45 | -0.43621 | -5.71 | -5.71 | -5.71 | -5.71 | -5.71 |
| Tax Rate, % | 8.06 | 8.06 | 8.06 | 8.06 | 8.06 | 8.06 | 8.06 | 8.06 | 8.06 | 8.06 |
| EBITAT | -23.4 | -124.7 | -1.9 | -34.3 | -29.9 | -.7 | -.7 | -.8 | -.8 | -.9 |
| Depreciation | ||||||||||
| Changes in Account Receivables | ||||||||||
| Changes in Inventories | ||||||||||
| Changes in Accounts Payable | ||||||||||
| Capital Expenditure | ||||||||||
| UFCF | -23.2 | -124.6 | 47.4 | -35.6 | -21.3 | -5.3 | -.5 | -.6 | -.6 | -.6 |
| WACC, % | 8.63 | 8.43 | 7.21 | 7.75 | 8.48 | 8.1 | 8.1 | 8.1 | 8.1 | 8.1 |
| PV UFCF | ||||||||||
| SUM PV UFCF | -6.7 | |||||||||
| Long Term Growth Rate, % | 2.00 | |||||||||
| Free cash flow (T + 1) | -1 | |||||||||
| Terminal Value | -11 | |||||||||
| Present Terminal Value | -7 | |||||||||
| Enterprise Value | -14 | |||||||||
| Net Debt | -52 | |||||||||
| Equity Value | 38 | |||||||||
| Diluted Shares Outstanding, MM | 29 | |||||||||
| Equity Value Per Share | 1.29 |
What You Will Receive
- Comprehensive Financial Model: Rafael Holdings, Inc.'s (RFL) actual data allows for accurate DCF valuation.
- Complete Forecast Control: Modify revenue growth, margins, WACC, and other essential drivers.
- Real-Time Calculations: Automatic updates provide immediate feedback as you adjust inputs.
- Professional-Grade Template: A polished Excel file crafted for high-quality valuation presentations.
- Flexible and Reusable: Designed for adaptability, enabling repeated use for thorough forecasting.
Key Features
- 🔍 Real-Life RFL Financials: Pre-filled historical and projected data for Rafael Holdings, Inc. (RFL).
- ✏️ Fully Customizable Inputs: Adjust all critical parameters (yellow cells) like WACC, growth %, and tax rates.
- 📊 Professional DCF Valuation: Built-in formulas calculate Rafael’s intrinsic value using the Discounted Cash Flow method.
- ⚡ Instant Results: Visualize Rafael’s valuation instantly after making changes.
- Scenario Analysis: Test and compare outcomes for various financial assumptions side-by-side.
How It Works
- Step 1: Download the Excel file.
- Step 2: Review pre-entered Rafael Holdings, Inc. (RFL) data (historical and projected).
- Step 3: Adjust key assumptions (yellow cells) based on your analysis.
- Step 4: View automatic recalculations for Rafael Holdings, Inc.'s (RFL) intrinsic value.
- Step 5: Use the outputs for investment decisions or reporting.
Why Choose This Calculator for Rafael Holdings, Inc. (RFL)?
- Accurate Data: Utilize real financials from Rafael Holdings, Inc. for dependable valuation outcomes.
- Customizable: Tailor essential parameters such as growth rates, WACC, and tax rates to align with your forecasts.
- Time-Saving: Pre-configured calculations save you from starting from the ground up.
- Professional-Grade Tool: Crafted specifically for investors, analysts, and consultants.
- User-Friendly: An intuitive design and clear step-by-step guidance make it accessible for everyone.
Who Should Use Rafael Holdings, Inc. (RFL)?
- Investors: Gain insights into potential investments with a robust analysis of Rafael Holdings, Inc. (RFL).
- Financial Analysts: Enhance your workflow with comprehensive financial models tailored for Rafael Holdings, Inc. (RFL).
- Consultants: Easily modify reports and presentations specific to Rafael Holdings, Inc. (RFL) for your clients.
- Finance Enthusiasts: Explore the intricacies of investment strategies using Rafael Holdings, Inc. (RFL) as a case study.
- Educators and Students: Utilize it as a hands-on resource in finance education focused on real-world applications.
What the Template Contains
- Preloaded RFL Data: Historical and projected financial data, including revenue, EBIT, and capital expenditures.
- DCF and WACC Models: Professional-grade sheets for calculating intrinsic value and Weighted Average Cost of Capital.
- Editable Inputs: Yellow-highlighted cells for adjusting revenue growth, tax rates, and discount rates.
- Financial Statements: Comprehensive annual and quarterly financials for deeper analysis.
- Key Ratios: Profitability, leverage, and efficiency ratios to evaluate performance.
- Dashboard and Charts: Visual summaries of valuation outcomes and assumptions.
Disclaimer
All information, articles, and product details provided on this website are for general informational and educational purposes only. We do not claim any ownership over, nor do we intend to infringe upon, any trademarks, copyrights, logos, brand names, or other intellectual property mentioned or depicted on this site. Such intellectual property remains the property of its respective owners, and any references here are made solely for identification or informational purposes, without implying any affiliation, endorsement, or partnership.
We make no representations or warranties, express or implied, regarding the accuracy, completeness, or suitability of any content or products presented. Nothing on this website should be construed as legal, tax, investment, financial, medical, or other professional advice. In addition, no part of this site—including articles or product references—constitutes a solicitation, recommendation, endorsement, advertisement, or offer to buy or sell any securities, franchises, or other financial instruments, particularly in jurisdictions where such activity would be unlawful.
All content is of a general nature and may not address the specific circumstances of any individual or entity. It is not a substitute for professional advice or services. Any actions you take based on the information provided here are strictly at your own risk. You accept full responsibility for any decisions or outcomes arising from your use of this website and agree to release us from any liability in connection with your use of, or reliance upon, the content or products found herein.