
|
Ruffer Investment Company Limited (RICA.L) DCF Valuation |
Fully Editable: Tailor To Your Needs In Excel Or Sheets
Professional Design: Trusted, Industry-Standard Templates
Investor-Approved Valuation Models
MAC/PC Compatible, Fully Unlocked
No Expertise Is Needed; Easy To Follow
Ruffer Investment Company Limited (RICA.L) Bundle
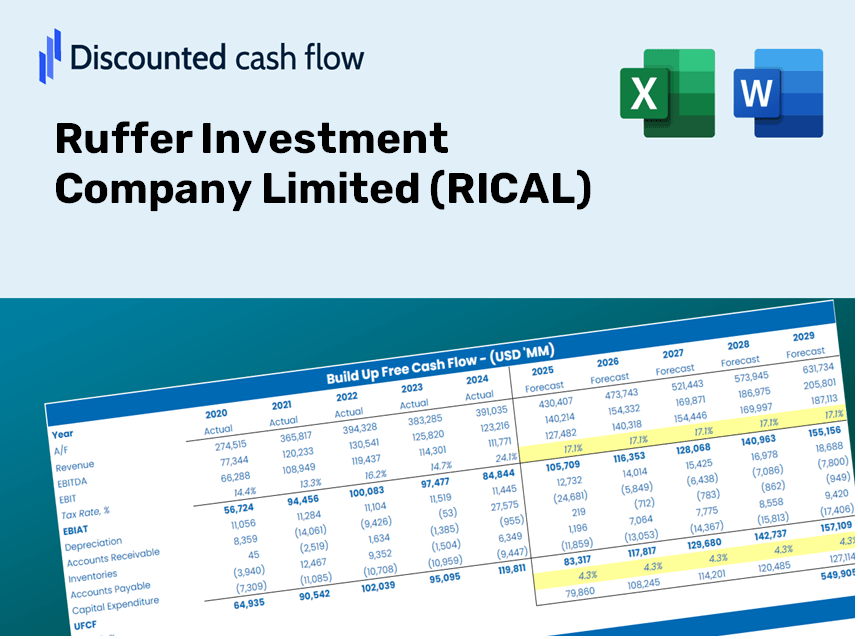
Enhance your investment choices using the (RICAL) DCF Calculator! Explore authentic financial data for Ruffer Investment Company Limited, adjust growth projections and expenses, and watch how these modifications instantly affect the intrinsic value of (RICAL).
Discounted Cash Flow (DCF) - (USD MM)
| Year | AY1 2019 |
AY2 2020 |
AY3 2021 |
AY4 2022 |
AY5 2023 |
FY1 2024 |
FY2 2025 |
FY3 2026 |
FY4 2027 |
FY5 2028 |
|---|---|---|---|---|---|---|---|---|---|---|
| Revenue | 37.8 | 60.3 | 33.6 | 67.2 | 19.6 | 21.7 | 24.1 | 26.8 | 29.8 | 33.1 |
| Revenue Growth, % | 0 | 59.36 | -44.27 | 100.16 | -70.88 | 11.05 | 11.05 | 11.05 | 11.05 | 11.05 |
| EBITDA | .0 | 68.2 | 30.5 | 16.5 | .0 | 9.4 | 10.4 | 11.5 | 12.8 | 14.2 |
| EBITDA, % | 0 | 113.21 | 90.73 | 24.5 | 0 | 43.05 | 43.05 | 43.05 | 43.05 | 43.05 |
| Depreciation | -49.5 | .0 | -45.9 | 50.5 | -7.6 | -7.1 | -7.9 | -8.8 | -9.7 | -10.8 |
| Depreciation, % | -130.8 | 0 | -136.63 | 75.19 | -38.63 | -32.69 | -32.69 | -32.69 | -32.69 | -32.69 |
| EBIT | 49.5 | 68.2 | 76.3 | -34.1 | 7.6 | 12.5 | 13.9 | 15.4 | 17.1 | 19.0 |
| EBIT, % | 130.8 | 113.21 | 227.36 | -50.7 | 38.63 | 57.59 | 57.59 | 57.59 | 57.59 | 57.59 |
| Total Cash | 42.7 | 55.8 | 91.9 | 50.5 | 18.8 | 20.2 | 22.4 | 24.9 | 27.6 | 30.7 |
| Total Cash, percent | .0 | .0 | .0 | .0 | .0 | .0 | .0 | .0 | .0 | .0 |
| Account Receivables | 8.8 | 4.7 | 29.7 | 2.0 | 3.5 | 6.1 | 6.8 | 7.5 | 8.4 | 9.3 |
| Account Receivables, % | 23.4 | 7.83 | 88.41 | 2.94 | 17.93 | 28.1 | 28.1 | 28.1 | 28.1 | 28.1 |
| Inventories | .0 | .0 | .0 | .0 | .0 | .0 | .0 | .0 | .0 | .0 |
| Inventories, % | 0 | 0 | 0 | 0 | 0 | 0 | 0 | 0 | 0 | 0 |
| Accounts Payable | 4.9 | .6 | 20.4 | .2 | .2 | 3.3 | 3.7 | 4.1 | 4.5 | 5.0 |
| Accounts Payable, % | 12.93 | 0.98854 | 60.67 | 0.26658 | 1.27 | 15.22 | 15.22 | 15.22 | 15.22 | 15.22 |
| Capital Expenditure | .0 | .0 | .0 | .0 | .0 | .0 | .0 | .0 | .0 | .0 |
| Capital Expenditure, % | 0 | 0 | 0 | 0.000005951251 | 0 | 0 | 0 | 0 | 0 | 0 |
| Tax Rate, % | 5.95 | 5.95 | 5.95 | 5.95 | 5.95 | 5.95 | 5.95 | 5.95 | 5.95 | 5.95 |
| EBITAT | 48.9 | 67.8 | 74.2 | -34.7 | 7.1 | 12.3 | 13.6 | 15.1 | 16.8 | 18.6 |
| Depreciation | ||||||||||
| Changes in Account Receivables | ||||||||||
| Changes in Inventories | ||||||||||
| Changes in Accounts Payable | ||||||||||
| Capital Expenditure | ||||||||||
| UFCF | -4.5 | 67.6 | 23.1 | 23.4 | -1.9 | 5.6 | 5.4 | 6.0 | 6.7 | 7.4 |
| WACC, % | 4.94 | 4.94 | 4.94 | 4.94 | 4.94 | 4.94 | 4.94 | 4.94 | 4.94 | 4.94 |
| PV UFCF | ||||||||||
| SUM PV UFCF | 26.8 | |||||||||
| Long Term Growth Rate, % | 3.00 | |||||||||
| Free cash flow (T + 1) | 8 | |||||||||
| Terminal Value | 394 | |||||||||
| Present Terminal Value | 309 | |||||||||
| Enterprise Value | 336 | |||||||||
| Net Debt | -19 | |||||||||
| Equity Value | 355 | |||||||||
| Diluted Shares Outstanding, MM | 378 | |||||||||
| Equity Value Per Share | 93.93 |
What You Will Gain
- Authentic RICAL Financial Data: Pre-loaded with Ruffer Investment Company Limited's historical and projected figures for accurate analysis.
- Completely Customizable Template: Easily adjust key factors such as revenue growth, WACC, and EBITDA percentage.
- Instant Calculations: Watch as RICAL's intrinsic value refreshes automatically with any alterations you make.
- Expert Valuation Tool: Tailored for investors, analysts, and consultants in pursuit of reliable DCF outcomes.
- Intuitive Design: A straightforward layout and clear guidance suitable for users of all skill levels.
Key Features
- 🔍 Real-Life RICAL Financials: Pre-filled historical and projected data for Ruffer Investment Company Limited (RICAL).
- ✏️ Fully Customizable Inputs: Modify all essential parameters (yellow cells) such as WACC, growth %, and tax rates.
- 📊 Professional DCF Valuation: Integrated formulas compute Ruffer’s intrinsic value using the Discounted Cash Flow method.
- ⚡ Instant Results: View Ruffer’s valuation instantly after making adjustments.
- Scenario Analysis: Evaluate and compare results for different financial assumptions side-by-side.
How It Functions
- 1. Access the Template: Download and open the Excel file containing Ruffer Investment Company Limited’s preloaded data.
- 2. Adjust Assumptions: Modify essential inputs such as growth rates, WACC, and capital expenditures.
- 3. Instant Result Calculations: The DCF model automatically computes intrinsic value and NPV in real-time.
- 4. Explore Scenarios: Analyze various forecasts to evaluate different valuation possibilities.
- 5. Present with Assurance: Deliver professional valuation insights to enhance your decision-making process.
Why Choose the Ruffer Investment Calculator?
- All-in-One Solution: Combines DCF, WACC, and financial ratio analyses tailored for Ruffer Investment Company Limited (RICAL).
- Flexible Parameters: Modify the highlighted fields to explore different investment scenarios.
- In-Depth Analysis: Automatically computes the intrinsic value and Net Present Value for RICAL.
- Integrated Data: Access both historical and projected data for precise evaluation.
- Expert-Level Tool: Perfect for financial analysts, investors, and business consultants focused on RICAL.
Who Can Benefit from Ruffer Investment Company Limited (RICAL)?
- Investors: Gain assurance in your investment choices with our advanced valuation tools.
- Financial Analysts: Streamline your workflow with our customizable, pre-designed DCF model.
- Consultants: Quickly modify our templates for impactful client presentations and reports.
- Finance Enthusiasts: Enhance your grasp of valuation methods through practical, real-world applications.
- Educators and Students: Utilize our tools as a hands-on resource in finance-focused courses.
Contents of the Template
- Pre-Filled DCF Model: Ruffer Investment Company Limited’s (RICAL) financial data preloaded for immediate analysis.
- WACC Calculator: Comprehensive calculations for Weighted Average Cost of Capital tailored to RICAL.
- Financial Ratios: Insight into RICAL’s profitability, leverage, and operational efficiency.
- Editable Inputs: Modify variables such as growth rates, margins, and capital expenditures to align with your projections.
- Financial Statements: Access to annual and quarterly reports for in-depth evaluation.
- Interactive Dashboard: Visualize essential valuation metrics and outcomes effortlessly.
Disclaimer
All information, articles, and product details provided on this website are for general informational and educational purposes only. We do not claim any ownership over, nor do we intend to infringe upon, any trademarks, copyrights, logos, brand names, or other intellectual property mentioned or depicted on this site. Such intellectual property remains the property of its respective owners, and any references here are made solely for identification or informational purposes, without implying any affiliation, endorsement, or partnership.
We make no representations or warranties, express or implied, regarding the accuracy, completeness, or suitability of any content or products presented. Nothing on this website should be construed as legal, tax, investment, financial, medical, or other professional advice. In addition, no part of this site—including articles or product references—constitutes a solicitation, recommendation, endorsement, advertisement, or offer to buy or sell any securities, franchises, or other financial instruments, particularly in jurisdictions where such activity would be unlawful.
All content is of a general nature and may not address the specific circumstances of any individual or entity. It is not a substitute for professional advice or services. Any actions you take based on the information provided here are strictly at your own risk. You accept full responsibility for any decisions or outcomes arising from your use of this website and agree to release us from any liability in connection with your use of, or reliance upon, the content or products found herein.