
|
RITES Limited (RITES.NS) DCF Valuation |
Fully Editable: Tailor To Your Needs In Excel Or Sheets
Professional Design: Trusted, Industry-Standard Templates
Investor-Approved Valuation Models
MAC/PC Compatible, Fully Unlocked
No Expertise Is Needed; Easy To Follow
RITES Limited (RITES.NS) Bundle
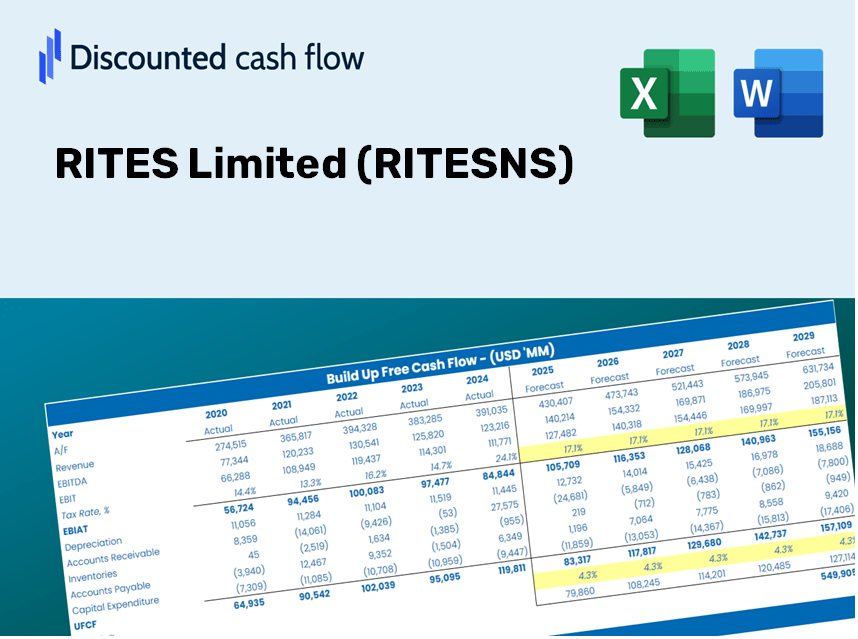
Discover the true value of RITES Limited (RITESNS) with our advanced DCF Calculator! Adjust key assumptions, explore various scenarios, and evaluate how fluctuations affect RITES Limited (RITESNS) valuation – all within a single Excel template.
Discounted Cash Flow (DCF) - (USD MM)
| Year | AY1 2021 |
AY2 2022 |
AY3 2023 |
AY4 2024 |
AY5 2025 |
FY1 2026 |
FY2 2027 |
FY3 2028 |
FY4 2029 |
FY5 2030 |
|---|---|---|---|---|---|---|---|---|---|---|
| Revenue | 19,053.0 | 26,618.3 | 26,282.7 | 24,528.5 | 22,178.1 | 23,408.4 | 24,706.9 | 26,077.5 | 27,524.1 | 29,050.9 |
| Revenue Growth, % | 0 | 39.71 | -1.26 | -6.67 | -9.58 | 5.55 | 5.55 | 5.55 | 5.55 | 5.55 |
| EBITDA | 5,444.1 | 7,185.2 | 7,394.8 | 6,383.6 | 5,085.3 | 6,210.6 | 6,555.1 | 6,918.7 | 7,302.5 | 7,707.6 |
| EBITDA, % | 28.57 | 26.99 | 28.14 | 26.03 | 22.93 | 26.53 | 26.53 | 26.53 | 26.53 | 26.53 |
| Depreciation | 464.4 | 601.1 | 611.3 | 548.8 | 556.7 | 551.0 | 581.6 | 613.8 | 647.9 | 683.8 |
| Depreciation, % | 2.44 | 2.26 | 2.33 | 2.24 | 2.51 | 2.35 | 2.35 | 2.35 | 2.35 | 2.35 |
| EBIT | 4,979.7 | 6,584.1 | 6,783.5 | 5,834.8 | 4,528.6 | 5,659.6 | 5,973.5 | 6,304.9 | 6,654.7 | 7,023.8 |
| EBIT, % | 26.14 | 24.74 | 25.81 | 23.79 | 20.42 | 24.18 | 24.18 | 24.18 | 24.18 | 24.18 |
| Total Cash | 34,736.1 | 33,743.6 | 34,707.0 | 31,380.1 | 9,596.8 | 20,752.5 | 21,903.7 | 23,118.8 | 24,401.3 | 25,754.9 |
| Total Cash, percent | .0 | .0 | .0 | .0 | .0 | .0 | .0 | .0 | .0 | .0 |
| Account Receivables | 8,081.0 | 9,924.2 | 12,005.4 | 12,211.6 | 7,452.2 | 9,773.5 | 10,315.7 | 10,887.9 | 11,491.9 | 12,129.4 |
| Account Receivables, % | 42.41 | 37.28 | 45.68 | 49.79 | 33.6 | 41.75 | 41.75 | 41.75 | 41.75 | 41.75 |
| Inventories | 2,861.6 | 1,187.5 | 309.1 | 49.3 | 780.8 | 1,141.3 | 1,204.6 | 1,271.4 | 1,342.0 | 1,416.4 |
| Inventories, % | 15.02 | 4.46 | 1.18 | 0.20099 | 3.52 | 4.88 | 4.88 | 4.88 | 4.88 | 4.88 |
| Accounts Payable | 2,963.8 | 1,810.9 | 3,021.1 | 2,198.6 | 3,642.8 | 2,773.5 | 2,927.4 | 3,089.8 | 3,261.2 | 3,442.1 |
| Accounts Payable, % | 15.56 | 6.8 | 11.49 | 8.96 | 16.43 | 11.85 | 11.85 | 11.85 | 11.85 | 11.85 |
| Capital Expenditure | -797.8 | -1,418.4 | -1,356.6 | -1,372.1 | -1,326.1 | -1,229.0 | -1,297.1 | -1,369.1 | -1,445.1 | -1,525.2 |
| Capital Expenditure, % | -4.19 | -5.33 | -5.16 | -5.59 | -5.98 | -5.25 | -5.25 | -5.25 | -5.25 | -5.25 |
| Tax Rate, % | 31.9 | 31.9 | 31.9 | 31.9 | 31.9 | 31.9 | 31.9 | 31.9 | 31.9 | 31.9 |
| EBITAT | 3,633.7 | 4,625.0 | 4,751.0 | 3,963.8 | 3,084.1 | 3,953.7 | 4,173.0 | 4,404.5 | 4,648.8 | 4,906.7 |
| Depreciation | ||||||||||
| Changes in Account Receivables | ||||||||||
| Changes in Inventories | ||||||||||
| Changes in Accounts Payable | ||||||||||
| Capital Expenditure | ||||||||||
| UFCF | -4,678.5 | 2,485.7 | 4,013.1 | 2,371.6 | 7,786.8 | -275.4 | 3,005.8 | 3,172.5 | 3,348.5 | 3,534.3 |
| WACC, % | 4.55 | 4.55 | 4.55 | 4.55 | 4.55 | 4.55 | 4.55 | 4.55 | 4.55 | 4.55 |
| PV UFCF | ||||||||||
| SUM PV UFCF | 10,895.1 | |||||||||
| Long Term Growth Rate, % | 2.00 | |||||||||
| Free cash flow (T + 1) | 3,605 | |||||||||
| Terminal Value | 141,478 | |||||||||
| Present Terminal Value | 113,269 | |||||||||
| Enterprise Value | 124,164 | |||||||||
| Net Debt | -9,307 | |||||||||
| Equity Value | 133,470 | |||||||||
| Diluted Shares Outstanding, MM | 481 | |||||||||
| Equity Value Per Share | 277.71 |
Benefits of Choosing RITES Limited
- Accurate RITES Financial Data: Access both historical and projected figures for precise valuation.
- Customizable Parameters: Adjust WACC, tax rates, revenue growth, and capital expenditures to fit your analysis.
- Dynamic Calculations: Automatic computation of intrinsic value and NPV based on your inputs.
- Comprehensive Scenario Analysis: Evaluate various scenarios to assess RITES's future performance.
- User-Friendly Interface: Designed for professionals but easy for novices to navigate.
Key Features
- Comprehensive RITES Financials: Gain access to precise historical data and future estimates tailored for RITES Limited (RITESNS).
- Adjustable Forecast Inputs: Modify the highlighted cells for parameters such as WACC, growth rates, and profit margins.
- Real-Time Calculations: Automatic refresh of DCF, Net Present Value (NPV), and cash flow evaluations.
- Interactive Dashboard: Intuitive charts and summaries that clearly present your valuation findings.
- Designed for All Skill Levels: A user-friendly format that caters to investors, CFOs, and consultants alike.
How It Operates
- Step 1: Download the Excel spreadsheet.
- Step 2: Examine the pre-populated RITES Limited (RITESNS) data (both historical and forecasted).
- Step 3: Modify key assumptions (highlighted in yellow) based on your findings.
- Step 4: Observe automatic updates reflecting RITES Limited’s (RITESNS) intrinsic value.
- Step 5: Utilize the results for your investment strategies or reporting needs.
Why Opt for the RITES Limited Calculator?
- User-Friendly Interface: Crafted for both newcomers and seasoned professionals.
- Customizable Inputs: Easily adjust parameters to tailor your analysis.
- Real-Time Updates: Observe immediate changes in RITES Limited's valuation as you modify inputs.
- Preloaded Data: Comes with RITES Limited's actual financial metrics for swift evaluations.
- Preferred by Experts: Utilized by investors and analysts for well-informed decision-making.
Who Should Benefit from RITES Limited (RITESNS)?
- Institutional Investors: Develop comprehensive and trustworthy valuation models for investment analysis.
- Corporate Finance Departments: Evaluate different valuation scenarios to inform strategic planning.
- Consultants and Financial Advisors: Deliver precise valuation insights for RITES Limited (RITESNS) to clients.
- Students and Academics: Utilize real-world data for practicing and teaching financial modeling techniques.
- Industry Analysts: Gain a deeper understanding of how infrastructure companies like RITES Limited (RITESNS) are valued in the market.
Contents of the Template
- Pre-Filled Data: Contains RITES Limited’s historical financial performance and projections.
- Discounted Cash Flow Model: A customizable DCF valuation model with automated calculations.
- Weighted Average Cost of Capital (WACC): A specific sheet for computing WACC using tailored inputs.
- Key Financial Ratios: Evaluate RITES Limited’s profitability, operational efficiency, and financial leverage.
- Customizable Inputs: Easily adjust revenue growth rates, profit margins, and tax assumptions.
- Comprehensive Dashboard: Visuals and tables that encapsulate essential valuation findings.
Disclaimer
All information, articles, and product details provided on this website are for general informational and educational purposes only. We do not claim any ownership over, nor do we intend to infringe upon, any trademarks, copyrights, logos, brand names, or other intellectual property mentioned or depicted on this site. Such intellectual property remains the property of its respective owners, and any references here are made solely for identification or informational purposes, without implying any affiliation, endorsement, or partnership.
We make no representations or warranties, express or implied, regarding the accuracy, completeness, or suitability of any content or products presented. Nothing on this website should be construed as legal, tax, investment, financial, medical, or other professional advice. In addition, no part of this site—including articles or product references—constitutes a solicitation, recommendation, endorsement, advertisement, or offer to buy or sell any securities, franchises, or other financial instruments, particularly in jurisdictions where such activity would be unlawful.
All content is of a general nature and may not address the specific circumstances of any individual or entity. It is not a substitute for professional advice or services. Any actions you take based on the information provided here are strictly at your own risk. You accept full responsibility for any decisions or outcomes arising from your use of this website and agree to release us from any liability in connection with your use of, or reliance upon, the content or products found herein.