
|
Ralph Lauren Corporation (RL): VRIO Analysis [Mar-2026 Updated] |
Fully Editable: Tailor To Your Needs In Excel Or Sheets
Professional Design: Trusted, Industry-Standard Templates
Investor-Approved Valuation Models
MAC/PC Compatible, Fully Unlocked
No Expertise Is Needed; Easy To Follow
Ralph Lauren Corporation (RL) Bundle
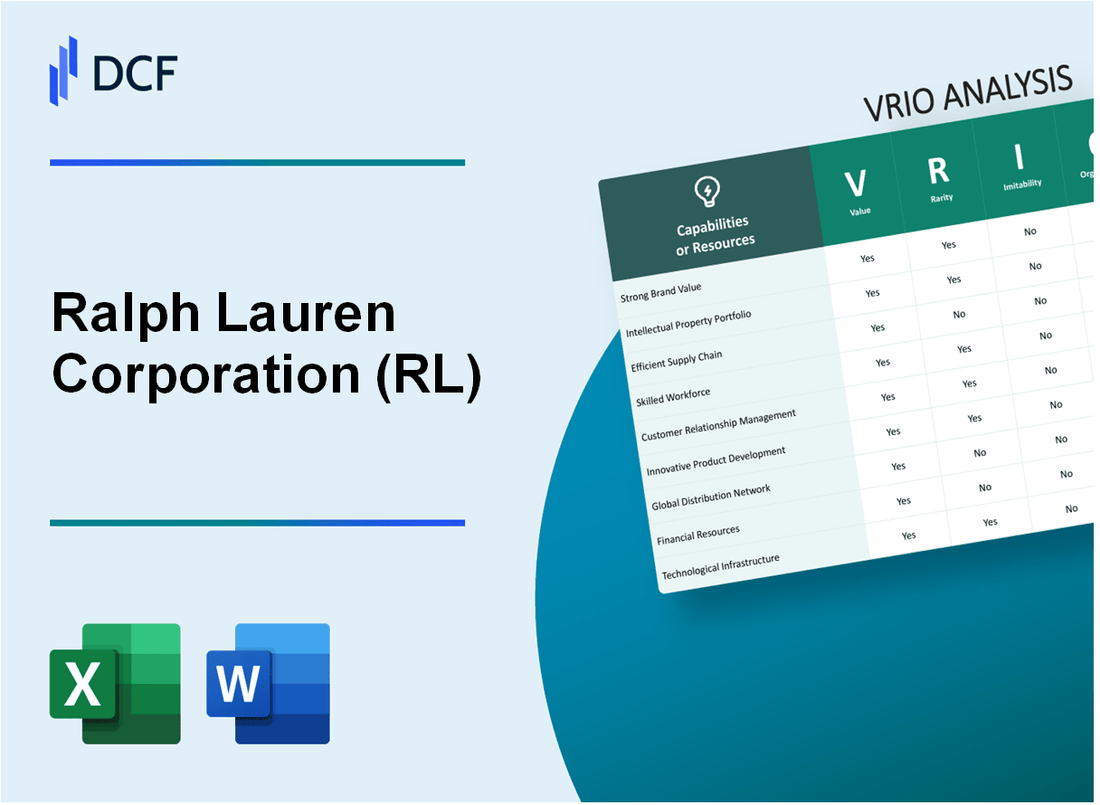
Unlocking the secrets to Ralph Lauren Corporation (RL)'s enduring success starts here: our VRIO analysis distills whether its core assets are truly Valuable, Rare, Inimitable, and Organized for competitive advantage. Don't just guess its future - read the concise findings below to see exactly where its power lies.
Ralph Lauren Corporation (RL) - VRIO Analysis: 1. Iconic Global Brand Equity & Lifestyle Positioning
You’re looking at Ralph Lauren Corporation (RL) and trying to figure out what truly locks in their long-term success. Honestly, it all comes back to that iconic brand equity. This isn't just marketing fluff; it’s a tangible asset that lets them charge more and keeps customers coming back, even when the economy is wobbly.
Value: Premium Pricing and Demand Foundation
The brand's value is clear in the numbers. In Fiscal 2025, Ralph Lauren Corporation hit total net revenues of $7.1 billion. A huge part of that was their pricing power. They achieved high single-digit growth in Average Unit Retail (AUR) for the full year, including a 10% jump in Q2 FY25 alone, which directly fueled their margin expansion. This pricing strength is why their adjusted gross margin hit 68.6% in Q4 of Fiscal 2025. It’s the foundation for their luxury lifestyle strategy.
Rarity: The Unique American Narrative
What makes it rare is the specific, aspirational narrative - that classic, aspirational American grace. While other brands have heritage, few have this exact cultural resonance globally. For instance, their high awareness is near 89%, and they command strong advocacy with an NPS of +33, which is tough for competitors to replicate quickly. It’s not just a logo; it’s a decades-long story.
Imitability: The Decades-Long Build
You can’t buy this overnight. Imitating this level of cultural embedding would take decades of consistent, high-quality storytelling and product focus. Fast-fashion players can copy the look, but they can’t copy the history or the perceived quality that allows RL to maintain a 14.0% adjusted operating margin, as reported for Fiscal 2025. That margin expansion proves the moat is deep.
Organization: Strategy Aligned to Brand Elevation
The organization is set up to maximize this asset. Their entire growth plan, the Next Great Chapter: Accelerate, centers on brand elevation. They are driving growth through high-margin channels, with global Direct-to-Consumer (DTC) comparable store sales up 10% for Fiscal 2025. They are disciplined; they ended FY2025 with over $2.1 billion in cash and short-term investments, ready to reinvest in the brand story.
Here’s the quick math on how this resource stacks up:
| VRIO Dimension | Assessment | Key Supporting Data (FY2025) |
| Value | Yes | Net Revenue of $7.1 billion; Adjusted Gross Margin of 68.6% (Q4) |
| Rarity | Yes | High Awareness (89%); Strong Advocacy (NPS +33) |
| Imitability | Difficult/Costly | Decades of consistent storytelling; High AUR growth offsetting cost pressures |
| Organization | Yes | DTC Comps up 10%; Strong balance sheet with $2.1 billion cash |
| Competitive Implication | Sustained Competitive Advantage | Brand equity acts as a powerful moat against lower-priced and some luxury peers |
What this estimate hides is the risk of brand fatigue if they fail to innovate, as some reports suggest their innovation score lags. Still, the core equity remains their biggest shield.
Finance: draft 13-week cash view by Friday.
Ralph Lauren Corporation (RL) - VRIO Analysis: 2. Diversified and Agile Global Supply Chain
Mitigates geopolitical risk and tariffs by allowing quick volume shifts; no single country accounts for more than 20% of production. Products from China currently represent roughly a 'high single-digit percentage' of the company's globally sourced units.
Moderate; while diversification is a trend, the five-continent network with single-digit reliance on China is rare for this scale.
Difficult; replicating the established supplier relationships and the internal analytics to manage this complexity takes years.
Strong; the company actively uses this agility to manage cost pressures, a key enabler of its strategy.
- The company works with key suppliers worldwide to 'flex volumes based on quality and cost'.
- The company is increasingly leveraging artificial intelligence and analytics to improve inventory planning.
- Goal to power operations with 100% renewable electricity by 2025.
- Goal to phase out the use of coal in manufacturing facilities by the end of 2025.
| Metric | Value | Context Year/Period |
| Global Revenue | $7.1 billion | Fiscal 2025 |
| Gross Margin | 68.6% | Fiscal 2025 |
| Adjusted Operating Margin | 14.0% | Fiscal 2025 |
| Capital Expenditure (CapEx) | $216 million | Fiscal 2025 |
| Active Tier 1 Facilities | Over 290 | As of late 2025 |
| Total Global Locations | 1,234 | Q2 CY2025 |
Temporary to Sustained; it's a sustained advantage until competitors fully regionalize, but its current execution is a near-term edge.
Ralph Lauren Corporation (RL) - VRIO Analysis: 3. Advanced Digital Ecosystem & Data Analytics
Value
Drives efficiency by improving demand forecasting (reducing inventory days to 164.31 TTM) and personalizing customer experiences. The digital ecosystem supports global Direct-to-Consumer (DTC) momentum, which saw comparable sales growth of 13% in Q2 FY2026. The company gained 5.9 million new DTC customers in FY25.
Rarity
Moderate; many peers use analytics, but the integration with the 'Ask Ralph AI assistant' is newer and specific. The company is scaling a multi-year digital transformation program.
Imitability
Moderate; the technology itself is imitable, but the proprietary data sets feeding the AI are not. The retailer has 'sizable rich data that understands our customers deeply'.
Organization
Strong; this is a core focus area, with investments accelerating digital transformation for better conversion. The company expects capital expenditures to account for 5% of its revenue in fiscal year 2026 as investments in technology ramp up. AI is being embedded across operations, with predictive buying used across 25% of its international DTC business.
Competitive Advantage
Temporary; it will become table stakes, but current deployment offers a temporary lead in efficiency. The brand's shares have surged 54.3% year to date against the industry's 14.9% decline.
| Metric | Value (Latest Reported) | Period/Context |
|---|---|---|
| Days Inventory Outstanding (DIO) | 183 days | Latest Twelve Months (ending June 2025) |
| Days Inventory Outstanding (DIO) | 175.86 days | Three months ended September 2025 |
| Average DIO (5-Year) | 163 days | Fiscal years ending March 2021 to 2025 |
| FY2025 Total Revenue | $7.1 billion | Full Year Fiscal 2025 |
| Q4 FY2025 Digital Commerce Sales Growth (Europe) | 25% | Fourth Quarter Fiscal 2025 |
| Q4 FY2025 Digital Commerce Sales Growth (Asia) | 27% | Fourth Quarter Fiscal 2025 |
Digital Ecosystem Performance Indicators:
- Digital ecosystem grew in the high teens, led by Europe.
- North America digital commerce comparable sales increased 8% in Q4 FY2025.
- The company's forward Price-to-Earnings (P/E) ratio is 21.77X compared with the industry's average of 16.22X.
- The Zacks Consensus Estimate for fiscal 2026 EPS indicates year-over-year growth of 25%.
Ralph Lauren Corporation (RL) - VRIO Analysis: 4. Strong Balance Sheet & Capital Allocation Discipline
Value: Provides financial flexibility for growth investments and shareholder returns; FY25 cash and equivalents were $1.92 billion.
Rarity: Moderate; a net debt to EBITDA of just 0.64x in FY25 is strong for the sector. The average Net Debt to EBITDA for the Apparel Manufacturing industry is cited as 2.16.
Imitability: Easy; financial strength is built over time, but it\'s not a unique operational capability.
Organization: Excellent; management is committed to returning at least $2 billion by FY2028 through dividends and share repurchases, and recently hiked the quarterly dividend by 10% to $0.9125 per share at the beginning of fiscal 2026, representing an annualized dividend of $3.65 per share.
The strong balance sheet is further evidenced by the following financial metrics from FY25:
| Metric | Amount | Source/Period |
|---|---|---|
| Cash and Cash Equivalents | $1.92 billion | FY25 |
| Net Debt to EBITDA | 0.64x | FY25 |
| Net Cash from Operating Activities | $1.24 billion | FY25 |
| Free Cash Flow | $1.02 billion | FY25 |
| Quarterly Cash Dividend (New Rate) | $0.9125 per share | Beginning of FY2026 |
| Annualized Dividend | $3.65 per share | Current |
The capital allocation discipline includes:
- Commitment to return at least $2 billion cumulatively to shareholders through FY2028.
- Capital expenditures are anticipated to be approximately 4% to 5% of revenues annually through fiscal 2028.
- The existing share repurchase authorization allows for up to $1.6 billion in share repurchases.
Competitive Advantage: Sustained; a strong balance sheet is always a sustained advantage in uncertain macro environments.
Ralph Lauren Corporation (RL) - VRIO Analysis: 5. Control and Protection of Intellectual Property (Trademarks)
Value: Secures global brand integrity, allowing for premium positioning and preventing consumer confusion, as seen in recent IP wins. The ability to enforce trademarks supports premium pricing and brand equity.
Rarity: Moderate; winning major trademark disputes, like the recent unification of South African Polo IP, is not common. Successfully resolving multi-decade territorial conflicts demonstrates a capability not frequently seen across the industry.
Imitability: Difficult; requires significant legal resources and successful navigation of varied international trademark laws. The successful enforcement actions require sustained, specialized legal investment.
Organization: Strong; the company is actively resolving territorial conflicts to ensure a unified global brand presence. The acquisition of the South African Polo brand, concluding a nearly 50-year split, demonstrates organizational commitment to brand coherence.
Competitive Advantage: Sustained; legal protection of core assets like the Polo mark is fundamental and hard to challenge once established. The value derived from these protections is core to the luxury positioning.
Quantifiable outcomes from recent intellectual property enforcement activities include:
| Metric | Value | Context/Date |
|---|---|---|
| China Trademark Damages Awarded | 20 million RMB (approx. $2.74 million) | Recent IP Win (2024) |
| Statutory Compensation Cap (China) | 5 million RMB ($684,000) | Context for the recent win |
| Duration of South Africa Polo Split | Nearly 50 years | Territorial Conflict Resolution |
| Fiscal 2024 Total Revenue | $6,631.40 million | Context for scale |
The company's commitment to brand defense is evidenced by the scale of legal victories and strategic acquisitions:
- The Shanghai Intellectual Property Court ordered infringing companies to cease activity and pay 20 million RMB in damages, a sum exceeding the statutory cap of 5 million RMB for trademark infringement in China.
- The acquisition of the South African Polo trademarks concluded a dispute that saw two near-identical logos operating independently for over 40 years.
- The financial terms for the South African acquisition were undisclosed.
- For Fiscal 2024, Ralph Lauren Corporation reported total revenue of $6,631.40 million.
- The company's intangible assets, which include trademarks, are recorded on the balance sheet net of accumulated amortization.
Ralph Lauren Corporation (RL) - VRIO Analysis: 6. Premium Product Portfolio & Core Icons
Value: The foundation of desirability; iconic products like the Polo shirt and oxford button-down drive repeat purchases and brand heat.
The core product strength, including iconic items, represents over 70% of the business. Resilient demand has been specifically noted for high-priced Polo shirts and cotton cable knit sweaters. The brand's overall revenue for Fiscal Year 2024 reached $6.631 billion.
Rarity: Moderate; many brands have icons, but Ralph Lauren's are deeply embedded in aspirational lifestyle codes.
The brand's presence in key global brand rankings, such as the Apparel 50 2024 and Apparel 50 2025 lists, underscores its recognized status, though other brands also possess icons.
Imitability: Difficult; imitation products lack the authentic heritage and quality cues that drive premium pricing.
The ability to command premium pricing is evidenced by the focus on Average Unit Retail ('AUR') growth, which has been in the double digits in certain periods, supporting margin expansion.
Organization: Strong; the strategy explicitly focuses on driving the core while expanding adjacent categories.
The organizational focus on the core is supported by financial results that show margin expansion alongside revenue growth, indicating effective execution of the premium strategy.
| Financial Metric (FY2024) | Amount/Rate | Context |
|---|---|---|
| Total Net Revenue | $6.631 billion | Full Year Fiscal 2024 Reported Revenue. |
| Reported Operating Margin | 11.4% | Full Year Fiscal 2024 Reported Operating Margin. |
| Adjusted Gross Margin (FY2023) | 66.3% | Fiscal 2023 Adjusted Gross Margin in constant currency. |
| Global Direct-to-Consumer Comparable Store Sales Growth | 6% | Full Year Fiscal 2024 Growth. |
| Total Company Locations | 564 | As of 2024. |
The strategy is executed through clear operational pillars:
- Driving the Core and Expanding for More: Core products constitute over 70% of the business.
- Elevate and Energize Our Lifestyle Brand: Leveraging global campaigns and brand magic.
- Win in Key Cities with Our Consumer Ecosystem.
Competitive Advantage: Sustained; the core product line is the anchor of the entire brand ecosystem.
The sustained demand for core icons, which underpins the majority of revenue and supports premium pricing, provides a durable competitive advantage against imitators lacking the associated heritage.
Ralph Lauren Corporation (RL) - VRIO Analysis: 7. Direct-to-Consumer (DTC) Channel Strength
Captures higher margins and offers direct consumer data; Q2 FY26 DTC comparable sales grew 13%.
| Metric | Value | Period/Context |
|---|---|---|
| Global DTC Comparable Store Sales Growth | 13% | Q2 FY26 |
| Gross Margin | 68.0% | Q2 FY26 |
| New DTC Customers Added | 1.5 million | Q2 FY26 |
| DTC Channel Revenue Share | Two-thirds | As of FY24 |
Moderate; many luxury firms are pushing DTC, but RL's omnichannel execution is a key differentiator.
Moderate; building out the physical and digital retail footprint takes significant capital and time.
Strong; the 'Next Great Chapter' plan heavily emphasizes scaling the digitally led ecosystem.
- Scale digitally-led, cohesive ecosystem strategy across top 30 cities globally.
- Begin developing the next 20 top cities to sustain long-term growth.
- Projected DTC sales to reach 75% of revenue by 2035.
- Digital ecosystem grew in the high teens in FY25, led by Europe.
- Digital sales growth in Q1 FY26: North America 19%, Europe 11%, Asia 35%.
Temporary to Sustained; the structural margin benefit from DTC is sustained, but execution must remain sharp.
Ralph Lauren Corporation (RL) - VRIO Analysis: 8. Circular Commerce/Vintage Resale Engine
Value: Creates a high-margin revenue stream from existing assets and drives brand heat with younger consumers; some vintage pieces resell at over 5x the typical rate.
Rarity: Rare; few heritage brands have successfully formalized and scaled the buy-back and resale of their own archive pieces.
Imitability: Difficult; requires the brand's own archive, authentication expertise, and control over the narrative.
Organization: Developing; this is an emerging capability tied to sustainability goals, but the early results are impressive.
Competitive Advantage: Temporary; if this model proves highly profitable, competitors will rush to copy the playbook quickly.
The control over the narrative allows Ralph Lauren to command a significant premium compared to peer-to-peer resale channels. For instance, where peer-to-peer sellers might achieve $90, Ralph Lauren can realize $450 by controlling the story, channel, and experience.
| Vintage Item Category | Resale Price Example (Brand Controlled) | Estimated Peer-to-Peer Price | Implied Multiplier |
|---|---|---|---|
| 1990s Polo Hunting Vest | $500 | Approx. $90 | Approx. 5.5x |
| Tweed Blazers, Trenches, Leather Coats | £300–£1,000+ | N/A | N/A |
| Polo Bear Sweaters (90s Grails) | £200+ | N/A | N/A |
The broader circular strategy is built under the “Live On” sustainability platform, which also encompasses rental, repair, and recycling initiatives.
- The brand's rental subscription service, 'The Lauren Look,' starts at USD 125 a month, including delivery and cleaning.
- The resale model leverages the brand's established trust, as consumers are willing to pay extra for authenticity, with up to 70% willing to pay more for items over $600.
- The second-hand fashion market globally reached €33 billion in 2021.
Ralph Lauren Corporation (RL) - VRIO Analysis: 9. Commitment to Sustainability & ESG Alignment
Value
Meets rising consumer and regulatory expectations, securing future supply; they achieved 98% meeting at least one sustainable material criteria in units produced in Fiscal Year 2025, against the goal of 100% sustainably sourced key materials by the end of 2025.
Rarity
Moderate; the breadth of material commitments (cotton, viscose, down, etc.) is notable, including phasing out on-site coal by year-end 2025.
Imitability
Easy; public commitments are easy to make, but achieving them is hard.
Organization
Strong; sustainability is embedded in the supply chain strategy and operational goals. The Company ended the third quarter of Fiscal 2025 with $2.1 billion in cash and short-term investments.
| Metric | Value | Period/Context |
| Net Revenue | $2.1 billion | Q3 Fiscal 2025 Reported |
| Revenue Growth (Reported) | 11% | Q3 Fiscal 2025 vs. Prior Year |
| Gross Margin | 68.4% | Q3 Fiscal 2025 Reported |
| Absolute GHG Reduction | 34% | From FY20 baseline (FY25 achievement) |
| Supplier Alignment | 70% | Business conducted with strategic/key suppliers (FY25) |
Competitive Advantage
Temporary; it prevents competitive disadvantage rather than creating a unique edge, unless they innovate beyond current standards.
Further organizational alignment is demonstrated through specific performance metrics:
- Net Income in Q3 Fiscal 2025 was $297 million on a reported basis.
- Earnings per diluted share (EPS) was $4.66 on a reported basis for Q3 Fiscal 2025.
- The goal for supplier alignment is reaching 80% of business conducted with strategic and key suppliers.
- The Company is working toward Circular Design Principles implementation by the end of 2025.
Disclaimer
All information, articles, and product details provided on this website are for general informational and educational purposes only. We do not claim any ownership over, nor do we intend to infringe upon, any trademarks, copyrights, logos, brand names, or other intellectual property mentioned or depicted on this site. Such intellectual property remains the property of its respective owners, and any references here are made solely for identification or informational purposes, without implying any affiliation, endorsement, or partnership.
We make no representations or warranties, express or implied, regarding the accuracy, completeness, or suitability of any content or products presented. Nothing on this website should be construed as legal, tax, investment, financial, medical, or other professional advice. In addition, no part of this site—including articles or product references—constitutes a solicitation, recommendation, endorsement, advertisement, or offer to buy or sell any securities, franchises, or other financial instruments, particularly in jurisdictions where such activity would be unlawful.
All content is of a general nature and may not address the specific circumstances of any individual or entity. It is not a substitute for professional advice or services. Any actions you take based on the information provided here are strictly at your own risk. You accept full responsibility for any decisions or outcomes arising from your use of this website and agree to release us from any liability in connection with your use of, or reliance upon, the content or products found herein.