
|
RLJ Lodging Trust (RLJ) DCF Valuation |
Fully Editable: Tailor To Your Needs In Excel Or Sheets
Professional Design: Trusted, Industry-Standard Templates
Investor-Approved Valuation Models
MAC/PC Compatible, Fully Unlocked
No Expertise Is Needed; Easy To Follow
RLJ Lodging Trust (RLJ) Bundle
Discover the true value of RLJ Lodging Trust (RLJ) with our professional-grade DCF Calculator! Adjust key assumptions, explore various scenarios, and evaluate how different changes affect RLJ's valuation – all within a single Excel template.
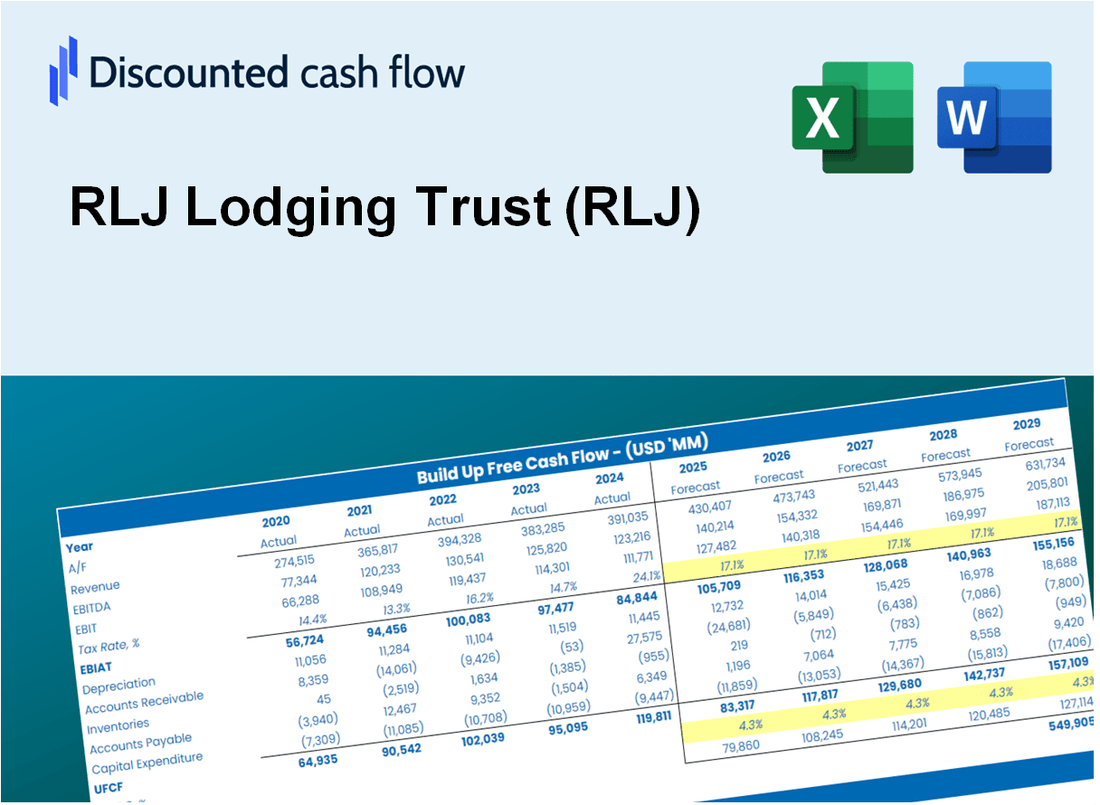
Discounted Cash Flow (DCF) - (USD MM)
| Year | AY1 2020 |
AY2 2021 |
AY3 2022 |
AY4 2023 |
AY5 2024 |
FY1 2025 |
FY2 2026 |
FY3 2027 |
FY4 2028 |
FY5 2029 |
|---|---|---|---|---|---|---|---|---|---|---|
| Revenue | 473.1 | 785.7 | 1,193.7 | 1,325.6 | 1,369.4 | 1,822.6 | 2,425.7 | 3,228.4 | 4,296.7 | 5,718.5 |
| Revenue Growth, % | 0 | 66.07 | 51.93 | 11.05 | 3.31 | 33.09 | 33.09 | 33.09 | 33.09 | 33.09 |
| EBITDA | -54.5 | -20.0 | 319.1 | 354.6 | 359.5 | 239.4 | 318.6 | 424.1 | 564.4 | 751.1 |
| EBITDA, % | -11.51 | -2.55 | 26.73 | 26.75 | 26.25 | 13.14 | 13.14 | 13.14 | 13.14 | 13.14 |
| Depreciation | 191.8 | 187.8 | 188.1 | 184.1 | 184.9 | 392.2 | 521.9 | 694.7 | 924.5 | 1,230.5 |
| Depreciation, % | 40.53 | 23.9 | 15.76 | 13.89 | 13.5 | 21.52 | 21.52 | 21.52 | 21.52 | 21.52 |
| EBIT | -246.2 | -207.8 | 130.9 | 170.6 | 174.5 | -152.8 | -203.3 | -270.6 | -360.1 | -479.3 |
| EBIT, % | -52.04 | -26.45 | 10.97 | 12.87 | 12.74 | -8.38 | -8.38 | -8.38 | -8.38 | -8.38 |
| Total Cash | 899.8 | 665.3 | 481.3 | 516.7 | 409.8 | 1,071.4 | 1,425.9 | 1,897.7 | 2,525.7 | 3,361.4 |
| Total Cash, percent | .0 | .0 | .0 | .0 | .0 | .0 | .0 | .0 | .0 | .0 |
| Account Receivables | 13.3 | 31.1 | 38.5 | 26.2 | 25.5 | 50.5 | 67.2 | 89.4 | 118.9 | 158.3 |
| Account Receivables, % | 2.82 | 3.96 | 3.23 | 1.97 | 1.86 | 2.77 | 2.77 | 2.77 | 2.77 | 2.77 |
| Inventories | .0 | .0 | .0 | .0 | .0 | .0 | .0 | .0 | .0 | .0 |
| Inventories, % | 0 | 0 | 0 | 0 | 0 | 0 | 0 | 0 | 0 | 0 |
| Accounts Payable | 172.3 | 155.1 | 155.9 | 147.8 | 154.6 | 334.2 | 444.8 | 591.9 | 787.8 | 1,048.5 |
| Accounts Payable, % | 36.43 | 19.75 | 13.06 | 11.15 | 11.29 | 18.34 | 18.34 | 18.34 | 18.34 | 18.34 |
| Capital Expenditure | -73.3 | -48.3 | -124.3 | -132.3 | -136.5 | -189.6 | -252.3 | -335.8 | -446.9 | -594.8 |
| Capital Expenditure, % | -15.5 | -6.14 | -10.41 | -9.98 | -9.97 | -10.4 | -10.4 | -10.4 | -10.4 | -10.4 |
| Tax Rate, % | 2.53 | 2.53 | 2.53 | 2.53 | 2.53 | 2.53 | 2.53 | 2.53 | 2.53 | 2.53 |
| EBITAT | -279.1 | -204.6 | 125.5 | 167.4 | 170.1 | -149.7 | -199.2 | -265.1 | -352.9 | -469.7 |
| Depreciation | ||||||||||
| Changes in Account Receivables | ||||||||||
| Changes in Inventories | ||||||||||
| Changes in Accounts Payable | ||||||||||
| Capital Expenditure | ||||||||||
| UFCF | -1.7 | -100.0 | 182.7 | 223.3 | 226.0 | 207.5 | 164.3 | 218.7 | 291.0 | 387.3 |
| WACC, % | 6.05 | 6.01 | 5.93 | 6 | 5.98 | 5.99 | 5.99 | 5.99 | 5.99 | 5.99 |
| PV UFCF | ||||||||||
| SUM PV UFCF | 1,045.8 | |||||||||
| Long Term Growth Rate, % | 3.50 | |||||||||
| Free cash flow (T + 1) | 401 | |||||||||
| Terminal Value | 16,083 | |||||||||
| Present Terminal Value | 12,022 | |||||||||
| Enterprise Value | 13,068 | |||||||||
| Net Debt | 1,929 | |||||||||
| Equity Value | 11,139 | |||||||||
| Diluted Shares Outstanding, MM | 153 | |||||||||
| Equity Value Per Share | 72.58 |
What You Will Receive
- Comprehensive Financial Model: RLJ Lodging Trust’s actual data facilitates accurate DCF valuation.
- Complete Forecast Control: Modify revenue growth, operating margins, WACC, and other essential factors.
- Real-Time Calculations: Automatic updates provide immediate results as you adjust inputs.
- Professional-Grade Template: A polished Excel file crafted for high-quality valuation.
- Flexible and Reusable: Designed for adaptability, allowing for repeated use in detailed forecasting.
Key Features
- Comprehensive DCF Calculator: Features detailed unlevered and levered DCF valuation models tailored for RLJ Lodging Trust (RLJ).
- WACC Calculator: Pre-configured Weighted Average Cost of Capital sheet with adjustable inputs specific to RLJ.
- Customizable Forecast Assumptions: Adjust growth rates, capital expenditures, and discount rates as needed for RLJ.
- Integrated Financial Ratios: Evaluate profitability, leverage, and efficiency ratios relevant to RLJ Lodging Trust (RLJ).
- Interactive Dashboard and Charts: Visual representations summarize essential valuation metrics for straightforward analysis of RLJ.
How It Works
- 1. Access the Template: Download and open the Excel file containing RLJ Lodging Trust’s (RLJ) preloaded data.
- 2. Modify Assumptions: Adjust essential inputs such as occupancy rates, revenue growth, and operational expenses.
- 3. View Results Instantly: The DCF model automatically computes intrinsic value and NPV based on your inputs.
- 4. Explore Scenarios: Analyze various forecasts to evaluate different valuation possibilities.
- 5. Present with Confidence: Share professional valuation insights to back your investment decisions.
Why Choose This Calculator for RLJ Lodging Trust (RLJ)?
- Accurate Data: Real RLJ financials provide trustworthy valuation outcomes.
- Customizable: Tailor key inputs such as growth rates, WACC, and tax rates to fit your forecasts.
- Time-Saving: Built-in calculations streamline the process, saving you from starting from scratch.
- Professional-Grade Tool: Crafted for investors, analysts, and consultants in the hospitality sector.
- User-Friendly: Easy-to-navigate design and clear instructions make it accessible for all users.
Who Should Use RLJ Lodging Trust (RLJ)?
- Real Estate Investors: Gain insights into lodging investments with a reliable analysis platform.
- Market Analysts: Streamline your research with comprehensive data on RLJ’s performance.
- Hospitality Consultants: Easily tailor reports for clients focusing on the lodging sector.
- Finance Enthusiasts: Explore the dynamics of the lodging market through detailed case studies.
- Educators and Students: Utilize it as a resource for understanding real estate investment strategies.
What the Template Contains
- Pre-Filled DCF Model: RLJ Lodging Trust’s financial data preloaded for immediate use.
- WACC Calculator: Detailed calculations for Weighted Average Cost of Capital.
- Financial Ratios: Evaluate RLJ Lodging Trust’s profitability, leverage, and efficiency.
- Editable Inputs: Change assumptions such as growth, margins, and CAPEX to fit your scenarios.
- Financial Statements: Annual and quarterly reports to support detailed analysis.
- Interactive Dashboard: Easily visualize key valuation metrics and results.
Disclaimer
All information, articles, and product details provided on this website are for general informational and educational purposes only. We do not claim any ownership over, nor do we intend to infringe upon, any trademarks, copyrights, logos, brand names, or other intellectual property mentioned or depicted on this site. Such intellectual property remains the property of its respective owners, and any references here are made solely for identification or informational purposes, without implying any affiliation, endorsement, or partnership.
We make no representations or warranties, express or implied, regarding the accuracy, completeness, or suitability of any content or products presented. Nothing on this website should be construed as legal, tax, investment, financial, medical, or other professional advice. In addition, no part of this site—including articles or product references—constitutes a solicitation, recommendation, endorsement, advertisement, or offer to buy or sell any securities, franchises, or other financial instruments, particularly in jurisdictions where such activity would be unlawful.
All content is of a general nature and may not address the specific circumstances of any individual or entity. It is not a substitute for professional advice or services. Any actions you take based on the information provided here are strictly at your own risk. You accept full responsibility for any decisions or outcomes arising from your use of this website and agree to release us from any liability in connection with your use of, or reliance upon, the content or products found herein.