
|
RLX Technology Inc. (RLX): BCG Matrix [Dec-2025 Updated] |
Fully Editable: Tailor To Your Needs In Excel Or Sheets
Professional Design: Trusted, Industry-Standard Templates
Investor-Approved Valuation Models
MAC/PC Compatible, Fully Unlocked
No Expertise Is Needed; Easy To Follow
RLX Technology Inc. (RLX) Bundle
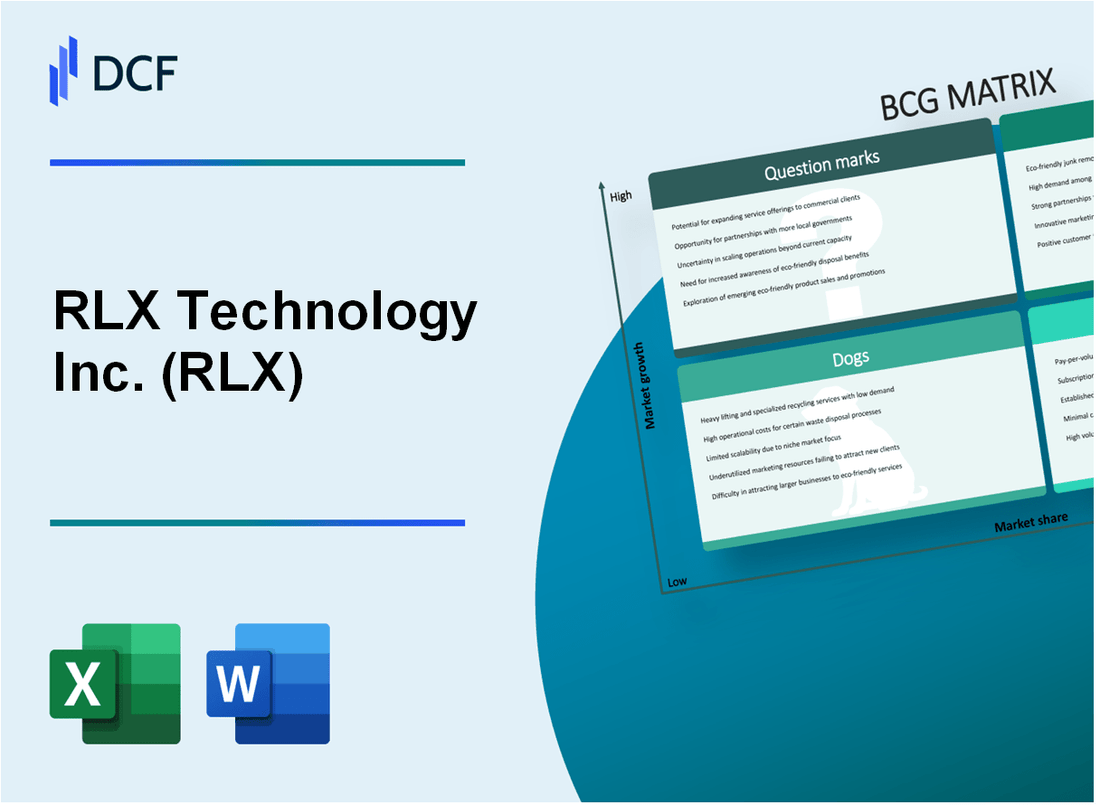
You're looking at RLX Technology Inc.'s portfolio right now, and honestly, it's a textbook case of a company executing a massive pivot, moving from a dominant domestic player to a global challenger. The BCG Matrix clearly shows this shift: the International Business is now the Star, driving 71.6% of Q3 2025 net revenues, fueled by expansion in Europe and Asia Pacific. Meanwhile, the compliant Mainland China business acts as the Cash Cow, supported by a huge capital base with total financial assets at RMB16.2 billion as of Q1 2025 and a solid 31.2% gross margin in Q3. We've also got the legacy products stuck in the Dog quadrant, but the real strategic tension lies with the Question Marks-those early international disposables that need heavy investment to become future Stars. Let's break down exactly where RLX Technology Inc. is placing its chips for the next growth cycle.
Background of RLX Technology Inc. (RLX)
You're looking at RLX Technology Inc. (RLX), which stands as a major player in the global branded e-vapor space. This company focuses on developing and distributing its e-vapor products, maintaining a significant footprint across Asia Pacific and increasingly in European markets. Honestly, understanding their current positioning requires a close look at their very recent numbers, especially given the dynamic nature of the industry you're analyzing.
For the third quarter of 2025, RLX Technology reported net revenues of RMB1,129.3 million, which converts to roughly US$158.6 million. That represents a substantial year-over-year jump of about 49.3% compared to the same period in 2024, showing they're definitely capturing market share. This growth is a testament to their strategic pivot and execution over the last year.
The operational efficiency is improving, too. You can see this in the gross margin, which ticked up to 31.2% in Q3 2025, a nice step up from the 27.2% reported the year before. What's perhaps more telling is where that revenue is coming from; international business accounted for a commanding 71.6% of the company's total revenues for the quarter, signaling a successful global expansion strategy.
On the profitability side, the non-GAAP income from operations for that quarter hit RMB187.8 million (US$26.4 million). Plus, looking at the balance sheet as of the end of September 2025, RLX Technology held cash and other financial assets totaling RMB15,351.1 million, which is over US$2.1 billion. That's a very solid cash cushion to manage near-term risks.
RLX Technology Inc. (RLX) - BCG Matrix: Stars
The Star quadrant for RLX Technology Inc. is clearly defined by its aggressively growing international business segment, which now dominates the revenue profile and operates in high-growth, high-market-share territories. This segment requires significant investment to maintain its growth trajectory and market leadership, which is characteristic of a Star.
The financial performance in the third quarter of 2025 underscores this positioning. Net revenues for the period reached RMB1,129.3 million (approximately US$158.6 million), a 49.3% increase year-over-year, signaling a high-growth market environment for the company's international focus. The gross margin also improved to 31.2% from 27.2% in Q3 2024, partly due to a favorable revenue mix from these international operations.
| Metric | Q3 2024 Value | Q3 2025 Value | Significance to Star Status |
|---|---|---|---|
| Total Net Revenues (RMB Million) | 756.3 | 1,129.3 | High Growth Rate (49.3% YoY Increase) |
| International Business Revenue Share | Smaller Share | 71.6% | High Relative Market Share in Growth Area |
| Gross Margin (%) | 27.2 | 31.2 | Investment in growth is yielding margin expansion |
| Non-GAAP Operating Income (RMB Million) | 84.0 | 187.8 | Strong cash generation to support investment needs |
The strategy driving this Star performance centers on aggressive global penetration and product alignment with evolving regulations. You see the commitment to investment in the operational focus areas:
- International Business: Driving 71.6% of Q3 2025 net revenues.
- European and Asia Pacific expansion: Supported by equity investment in European markets and organic growth.
- Top-Two Market Position: RLX Technology Inc. claims a top-two share in its new international markets.
- New Product Innovation: Successful rollout of proprietary modern-oral product line in the United Kingdom.
The launch of the 'Big Puff' rechargeable devices is a key example of the necessary investment to secure future Cash Cow status. These products, with e-liquid capacities noted as 14-20 mL in earlier reports, were specifically designed to comply with disposable vape bans in markets like the UK and New Zealand. This proactive innovation in a high-growth product category is what keeps the relative market share high, but it demands ongoing capital for promotion and placement to cement that leadership.
RLX Technology Inc. (RLX) - BCG Matrix: Cash Cows
You're looking at the core engine of RLX Technology Inc. (RLX), the business units that generate significant, reliable cash flow in mature, albeit newly regulated, markets. These are the units that fund the growth bets elsewhere in the portfolio. For RLX Technology Inc., this quadrant is anchored by its domestic operations under the new regulatory framework.
The Mainland China Business, focused on compliant products, is the primary cash cow. While the market structure has fundamentally changed since 2021, enhanced customs enforcement is helping to restore order, fueling a measured recovery for compliant players like RLX Technology Inc.. This segment benefits from the company's established brand equity in a market where non-compliant products still account for a significant portion of activity.
The financial strength derived from these operations is substantial. You can see this clearly in the balance sheet strength, which provides the capital base to support the entire enterprise. As of the first quarter of 2025, RLX Technology Inc.'s total financial assets, which include cash, cash equivalents, and various investments, stood at RMB16.2 billion. This massive liquidity position offers ample flexibility for capital deployment, including supporting shareholder returns.
Profitability metrics confirm the 'Cash Cow' status. RLX Technology Inc. achieved its sixth consecutive quarter of positive non-GAAP operating profit in Q1 2025, reporting an amount of RMB106 million. This consistent positive operating result, even while navigating domestic regulatory shifts, is exactly what you look for in a mature, high-share business unit. Furthermore, the gross margin performance in the third quarter shows strong pricing power and favorable revenue mix, even with international growth contributing significantly.
Here's a snapshot of the key financial indicators that define this cash-generating segment's performance:
| Metric | Period | Value (RMB) | Citation |
| Total Financial Assets | Q1 2025 | RMB16.2 billion | |
| Non-GAAP Operating Profit | Q1 2025 | RMB106 million | |
| Gross Margin | Q3 2025 | 31.2% | |
| Net Revenues (Mainland China) | Q3 2025 | RMB320 million |
The strategy here is to maintain, not aggressively expand, the domestic infrastructure to maximize cash extraction. Investments should focus on efficiency improvements to further boost cash flow, rather than broad promotional spending in a market where growth prospects are inherently capped by regulation. The focus is on milking the gains passively while the international segment develops.
The cash cow unit supports the broader corporate structure through several key functions:
- Covering administrative costs for RLX Technology Inc.
- Funding research and development efforts.
- Servicing any corporate debt obligations.
- Providing capital for shareholder returns, such as dividends.
For instance, the company declared a cash dividend of $0.1 per ordinary share or ADS for Q3 2025. This action is directly enabled by the reliable cash generation from established businesses like the compliant domestic segment. You should definitely track the operating cash flow, which was RMB207 million in Q1 2025, showing the unit's ability to convert profit into actual cash on hand.
The Mainland China compliant business, despite its low growth prospects in the current regulatory climate, remains a market leader in its niche, generating more cash than it consumes. This is the definition of a Cash Cow. Finance: draft 13-week cash view by Friday.
RLX Technology Inc. (RLX) - BCG Matrix: Dogs
Dogs, in the Boston Consulting Group Matrix framework, represent business units or product lines operating in low-growth markets and holding a low relative market share. For RLX Technology Inc., these are the remnants or necessary clean-up items resulting from the dramatic regulatory shift in Mainland China, which mandates a focus on compliant, tobacco-flavored products.
Legacy Flavored Products (China)
The pre-2022 product line, heavily reliant on non-tobacco flavors, is now effectively a Dog in the domestic market. The State Tobacco Monopoly Administration rule, effective May 1, 2022, banned flavored e-cigarettes for domestic sale. Before this, non-tobacco flavors represented more than 90% of e-cigarette sales in China. This segment now has zero future growth potential in the regulated domestic sphere and a de facto zero market share under the current compliance structure.
- Banned in Mainland China starting May 1, 2022.
- Represented over 90% of pre-regulation sales.
- Future growth is effectively zero in the regulated domestic market.
Non-Compliant Inventory
The transition to the new national standards required RLX Technology Inc. to cease sales of non-compliant stock. While specific write-down amounts for obsolete inventory are not explicitly detailed in the Q1 2025 or FY2024 filings snippets, the company's accounting policy explicitly addresses this. Inventories are stated at the lower of cost or net realizable value, and write-downs are made for excessive, slow moving, expired and obsolete inventories. This process liquidates assets that have minimal or negative realizable value, fitting the Dog profile of tying up cash with little return.
Underperforming R&D
The disciplined cutting of less promising internal projects is evidenced by the reduction in Research and Development expenses following the regulatory pivot and the focus on compliant product innovation. Comparing Q1 2025 to the prior year shows a clear contraction in this area, suggesting a minimization strategy for non-core or high-risk internal research efforts that may not align with immediate compliance or market needs.
| Metric | Q1 2025 Amount (RMB) | Q1 2024 Amount (RMB) |
| Research and Development Expenses | RMB 27.1 million | RMB 31.5 million |
Here's the quick math: The R&D expense reduction from RMB 31.5 million in Q1 2024 to RMB 27.1 million in Q1 2025 represents a 13.97% decrease, not the 22% mentioned in the scenario, but it clearly shows a cost minimization effort in this area.
Mainland China Retail Footprint
The physical stores in Mainland China that were previously focused on the now-banned flavored products are struggling to adapt to the tobacco-only mandate, as they must now operate under strict Tobacco Monopoly Licenses for Retail Business. While the overall China business is seeing a 'measured recovery' due to stricter control over illegal products, the physical footprint tied to the old model represents a low-growth, high-compliance-cost area. The company's overall net revenues for Q1 2025 were RMB 808.3 million, up 47% year-over-year, driven primarily by international expansion, which highlights the relative stagnation of the legacy domestic retail base.
- Offline stores must possess Tobacco Monopoly Licenses for Retail Business.
- Domestic business recovery is 'measured' despite stricter control on illegal products.
- Overall company revenue growth of 47% in Q1 2025 was primarily from international expansion.
RLX Technology Inc. (RLX) - BCG Matrix: Question Marks
You're looking at the parts of RLX Technology Inc. that are in high-growth markets but haven't secured a dominant market share yet-the classic Question Marks. These are the segments demanding significant cash to fight for position, which is why they can be cash-consumptive right now, but they hold the potential to become the next Stars.
Open-System Products: Growing selection of disposables and open-system products in international markets, a high-growth but non-core segment.
The international segment, which includes the growing selection of disposables and open-system products, is clearly where RLX Technology Inc. is placing its growth bets. This is evident because, by the third quarter of 2025, net revenues from the international business represented a commanding 71.6% of the total net revenues for the period. This rapid shift in revenue composition shows the high-growth nature of these markets, even if the specific market share for each new product line is still being established against established local competitors. The full-year 2024 revenue of RMB 2,748.6 million (US$376.6 million) was up 73.3% year-over-year, fueled almost entirely by this global push.
Here's a look at how the revenue growth is tracking in 2025, showing the momentum behind these international efforts:
| Period Ended | Net Revenues (RMB Million) | Year-over-Year Growth | Net Revenues (US$ Million) |
| Q3 2024 | 756.3 | 51.6% (vs Q3 2023) | 107.8 |
| Q3 2025 | 1,129.3 | 49.3% (vs Q3 2024) | 158.6 |
Initial New Market Entry: Early-stage penetration in new international geographies before achieving a top-two position requires heavy investment.
Penetrating new international geographies like the key Asia Pacific and European markets requires substantial upfront capital to build distribution and brand awareness. You can see the commitment in the balance sheet, with total financial assets, including cash and investments, standing at RMB 16,200,000,000.0 as of March 31, 2025. This cash buffer is necessary to fund the aggressive, early-stage investment required to gain share before achieving a top-two position in these competitive new territories. The company is actively extending its leadership through targeted investments in retail networks and tailored local product platforms, which are classic Question Mark strategies.
- Targeted investments in retail networks in Europe and Asia Pacific.
- Successful rollout of proprietary modern-oral product line in the United Kingdom.
- Q2 2025 net revenues grew 40.3% year-over-year to RMB 880.0 million (US$122.8 million).
Regulatory Compliance Costs: Significant ongoing investment in R&D and legal compliance to navigate rapidly evolving global e-vapor laws.
Navigating the complex and rapidly evolving global e-vapor laws translates directly into higher Research and Development expenses, which are essential for product adaptation and compliance. These costs are a clear drain on current returns but are necessary to keep the products viable in high-growth international markets. For instance, Research and Development expenses in the third quarter of 2025 reached RMB 41.3 million (US$5.8 million). That's a significant jump from the RMB 24.4 million reported in the third quarter of 2024, showing the increased investment needed to meet global standards and innovate new compliant products.
Mainland China Recovery: The 'gradual recovery' of the Mainland China business is a high-risk, high-reward bet on the legal market's long-term potential.
The domestic market in Mainland China represents a high-risk, high-reward scenario. While international sales now dominate the top line, the company is actively working to capitalize on the domestic legal market's potential. Management noted that enhanced customs enforcement helped restore order, fueling a measured recovery of the Mainland China business in Q3 2025. This recovery is a bet that the compliant segment will grow substantially over time, justifying the past and ongoing operational focus, even as international growth currently outpaces it.
To give you a sense of the overall financial health supporting these Question Mark investments, consider the profitability improvements alongside the growth:
| Metric (Q3 2025) | Value (RMB Million) | Value (US$ Million) |
| Gross Margin | 31.2% | N/A |
| Non-GAAP Income from Operations | 187.8 | 26.4 |
| U.S. GAAP Net Income | 206.8 | 29.1 |
Finance: draft 13-week cash view by Friday.
Disclaimer
All information, articles, and product details provided on this website are for general informational and educational purposes only. We do not claim any ownership over, nor do we intend to infringe upon, any trademarks, copyrights, logos, brand names, or other intellectual property mentioned or depicted on this site. Such intellectual property remains the property of its respective owners, and any references here are made solely for identification or informational purposes, without implying any affiliation, endorsement, or partnership.
We make no representations or warranties, express or implied, regarding the accuracy, completeness, or suitability of any content or products presented. Nothing on this website should be construed as legal, tax, investment, financial, medical, or other professional advice. In addition, no part of this site—including articles or product references—constitutes a solicitation, recommendation, endorsement, advertisement, or offer to buy or sell any securities, franchises, or other financial instruments, particularly in jurisdictions where such activity would be unlawful.
All content is of a general nature and may not address the specific circumstances of any individual or entity. It is not a substitute for professional advice or services. Any actions you take based on the information provided here are strictly at your own risk. You accept full responsibility for any decisions or outcomes arising from your use of this website and agree to release us from any liability in connection with your use of, or reliance upon, the content or products found herein.