
|
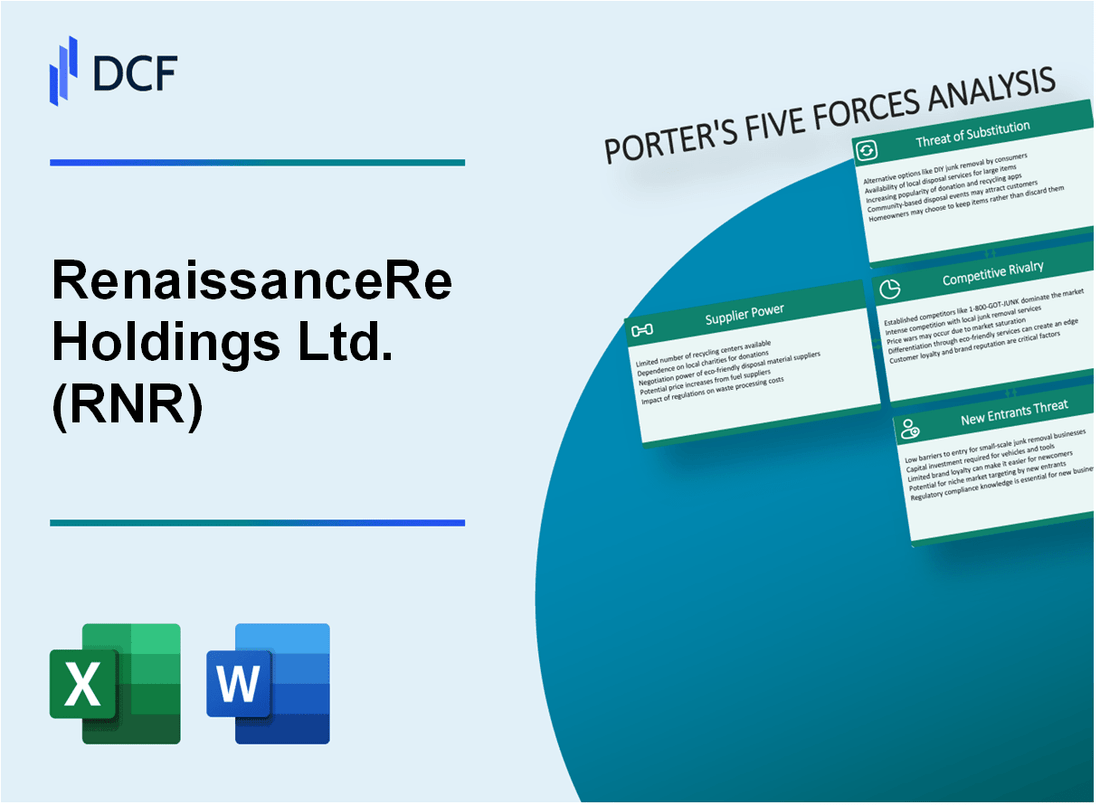
RenaissanceRe Holdings Ltd. (RNR): 5 FORCES Analysis [Apr-2026 Updated] |
Fully Editable: Tailor To Your Needs In Excel Or Sheets
Professional Design: Trusted, Industry-Standard Templates
Investor-Approved Valuation Models
MAC/PC Compatible, Fully Unlocked
No Expertise Is Needed; Easy To Follow
RenaissanceRe Holdings Ltd. (RNR) Bundle
You're looking to size up RenaissanceRe Holdings Ltd. (RNR) right now, and honestly, the competitive picture is a classic mix of strong defense and emerging offense. As of late 2025, RNR is clearly winning the pricing battle, securing things like an 80% write on Florida renewal premiums at private rates, which shows their specialized models give customers little choice, especially with property reinsurance rates up +7.5% recently. But, we can't ignore the growing pressure from substitutes; the Insurance-Linked Securities (ILS) market is now a $41.6 billion force, a direct challenge to their capacity. While high capital barriers keep new players out, and RNR posted a solid $907.7 million Net Income in Q3 2025, understanding where each of Porter's five forces lands is crucial for your next move. Let's break down exactly where the leverage sits for RNR and its rivals below.
RenaissanceRe Holdings Ltd. (RNR) - Porter's Five Forces: Bargaining power of suppliers
The bargaining power of suppliers for RenaissanceRe Holdings Ltd. (RNR) is concentrated, primarily driven by the specialized nature of the services required for advanced risk assessment and capital management. You see this power most clearly in two distinct areas: the providers of proprietary catastrophe modeling software and the sources of third-party retrocession capital.
For modeling, the market structure itself grants leverage to the key players. The catastrophe risk modelling marketplace remains largely a duopoly, dominated by a couple of vendors, specifically AIR Worldwide and Risk Management Solutions (RMS), even as of late 2025. This limited competition creates high barriers to entry for new vendors and, consequently, high barriers to switching for RenaissanceRe Holdings Ltd. While RenaissanceRe Holdings Ltd. has a history of collaboration with firms like AIR Worldwide to advance casualty risk modeling, the reliance on these established, sophisticated tools means that when RenaissanceRe Holdings Ltd. needs to update or integrate new models, the incumbent vendors hold significant sway. This dependence is compounded by the technical difficulty of changing platforms.
We can quantify this supplier leverage through the estimated costs and relationship stability:
| Supplier Metric | Data Point |
|---|---|
| Estimated Switching Cost Impact | 3-5% of annual technology budget |
| Average Vendor Relationship Length | 5.7 years |
| Annual Technology Procurement Budget (Estimated) | $17.3 million |
The estimated switching cost, pegged at 3-5% of RenaissanceRe Holdings Ltd.'s annual technology budget, reflects the deep integration of these models into underwriting and exposure management processes. For context, RenaissanceRe Holdings Ltd.'s total investments stood at $34.5 billion as of June 30, 2025, indicating a substantial operational footprint that relies on these core technologies. If the technology budget is around the estimated $17.3 million, that switching cost could represent a significant operational hurdle, giving vendors leverage during renewal negotiations.
Furthermore, the power of capital suppliers-the retrocession providers and third-party investors-is a critical factor. RenaissanceRe Holdings Ltd. explicitly notes its dependence on raising capital on acceptable terms as a key risk factor. This dependence is managed partly through its Capital Partners unit, which raised $1.2 billion in third-party capital in 2023 and an additional $237.8 million effective January 1, 2025. The ability of these external capital providers to deploy funds-or withhold them-directly impacts RenaissanceRe Holdings Ltd.'s capacity to write new business and manage peak risks. The stability of these relationships, reflected in the 5.7 years average tenure with key vendors, suggests a degree of mutual reliance, but also vendor complacency.
The supplier power dynamic is further illustrated by the operational reliance on external services, which can be summarized as follows:
- Limited number of specialized catastrophe modeling vendors.
- High integration of proprietary modeling software into core systems.
- Need to secure sufficient retrocession capacity for peak perils.
- Vendor stability averaging 5.7 years suggests sticky relationships.
- Potential cost of disruption estimated at 3-5% of tech spend.
To be fair, RenaissanceRe Holdings Ltd.'s strong underwriting performance, such as the $1.6 billion underwriting income reported for the full year 2024, and its Q3 2025 operating income of $733.7 million, does give it some counter-leverage as a desirable counterparty. Still, the specialized, mission-critical nature of the supplier inputs keeps this bargaining power elevated.
Finance: draft a sensitivity analysis on the impact of a 10% increase in the technology budget due to model price hikes by Friday.
RenaissanceRe Holdings Ltd. (RNR) - Porter's Five Forces: Bargaining power of customers
You're analyzing RenaissanceRe Holdings Ltd. (RNR) and the power its customers hold. Honestly, for a reinsurer like RNR, the customer base isn't the typical consumer; it's a highly specialized group, which fundamentally shifts the dynamic.
The bargaining power of customers is kept in check because RNR's clientele consists of large, sophisticated primary insurers and global institutions. These aren't buyers looking for a simple commodity. They are seeking complex risk transfer mechanisms, often for exposures that are difficult to model or price, like major catastrophes. Furthermore, RenaissanceRe Holdings Ltd. (RNR) actively designs specialized, complex risk solutions that inherently reduce customer price sensitivity. When you can engineer a solution for a primary insurer's biggest, most complex problems, you move beyond simple rate negotiation; you become a necessary partner. This ability to design better solutions incentivizes customers to come to RenaissanceRe Holdings Ltd. (RNR) first, as noted by management, securing better-than-market terms on key placements.
The success of this strategy is visible in their execution, particularly in challenging markets. For instance, during the mid-year renewals, RenaissanceRe Holdings Ltd. (RNR) secured superior terms, writing 80% of its Florida renewal premiums at private rates, meaning terms negotiated directly between the two parties, often above the broader market pricing. This demonstrates a clear ability to dictate terms rather than simply accept them.
The nature of the business supports high contract values, reflecting the scale of risk assumed. We see that customized contracts RenaissanceRe Holdings Ltd. (RNR) writes carry a high average value, reported around $75.3 million per client. This high average value suggests deep, sticky relationships where the primary insurer relies heavily on RenaissanceRe Holdings Ltd. (RNR)'s capacity and expertise for significant portions of their retained risk portfolio.
The broader market environment in the near term has also worked to RenaissanceRe Holdings Ltd. (RNR)'s advantage, effectively lowering customer leverage. Market hardening has significantly increased pricing power across the sector. Specifically, property reinsurance rates saw an increase of +7.5% between 2023 and 2024, a period where primary insurers were forced to retain more risk themselves, thus increasing their need for quality reinsurance partners like RenaissanceRe Holdings Ltd. (RNR).
Here's a quick look at the factors influencing customer power:
- Customers are sophisticated global institutions.
- Solutions are specialized, reducing simple price shopping.
- High average contract value: $75.3 million.
- Pricing power demonstrated in Florida renewals.
To put the recent pricing strength into context, consider the following data points related to market conditions that limit customer pushback:
| Metric | Value/Period | Source Context |
|---|---|---|
| Florida Private Rate Premium Share | 80% (Q2 2025) | Secured superior terms on Florida renewals |
| Property Reinsurance Rate Increase | +7.5% (2023-2024) | Reflects market hardening and pricing power |
| Average Customized Contract Value | $75.3 million | Indicates reliance on large-scale solutions |
| Q3 2025 Catastrophe Class GWP Growth (Underlying) | 21.9% (Ex-reinstatement premiums) | Shows strong organic growth with existing clients |
The ability of RenaissanceRe Holdings Ltd. (RNR) to grow its US property cat business by a robust 13% in the recent year, by selecting the most attractive risks, shows they are choosing their engagements carefully, further cementing their position of strength against the buyer. When you are co-investing with third-party capital providers who are institutional investors seeking uncorrelated returns, it aligns incentives toward disciplined underwriting, which further constrains the ability of the primary insurer to demand lower terms.
Finance: draft 13-week cash view by Friday.
RenaissanceRe Holdings Ltd. (RNR) - Porter's Five Forces: Competitive rivalry
RNR faces intense competitive rivalry from established global players. Here's a snapshot of the competitive landscape:
| Rival Firm | Reported Market Share (Approx. Late 2025) |
| Swiss Re | 7.3% |
| Hannover Re | 5.7% |
The market itself is undergoing structural shifts, evidenced by approximately $12.3 billion in M&A activity across the sector between 2023 and 2024. Still, RenaissanceRe Holdings Ltd. maintains a competitive edge through technological investment.
RenaissanceRe Holdings Ltd. differentiates its underwriting capability by investing $86 million in advanced risk modeling, which has resulted in a reported 15% improved accuracy in risk assessment. This focus on proprietary science supports strong financial outcomes, with Q3 2025 Net Income reaching $907.7 million.
The intensity of rivalry is sustained by several structural factors:
- Slow market growth in certain segments limits easy expansion opportunities.
- High exit barriers, such as capital lock-up requirements, keep competitors engaged.
- The need to deploy significant capital, with the global reinsurance sector backed by approximately $500 billion in capital as of mid-2025, drives competitive pricing pressure.
- Alternative capital, which surpassed a record $113 billion as of mid-2024, adds capacity, further intensifying competition for quality risk.
RenaissanceRe Holdings Ltd. (RNR) - Porter's Five Forces: Threat of substitutes
Alternative Risk Transfer (ART) mechanisms represent a persistent and growing substitute threat to RenaissanceRe Holdings Ltd.'s core property catastrophe reinsurance business. You see this capital flowing directly into structures that compete for the same risk premium dollars.
The Insurance-Linked Securities (ILS) market, a primary component of ART, shows significant scale. The ILS market reached $41.6 billion in 2023, marking a 13.5% growth that year. By mid-2025, the outstanding catastrophe bond market size surpassed the $50 billion benchmark, climbing to nearly $56 billion by the midpoint of the year. The first half of 2025 alone saw over $17 billion in new catastrophe bond issuance.
Alternative capital providers, which act as a direct substitute for RenaissanceRe Holdings Ltd.'s capacity, hold a significant portion of the overall reinsurance capital base. While historical figures suggest alternative capital providers hold 22% of the market, more recent mid-2025 data shows non-life alternative reinsurance capital at $118 billion. Considering global reinsurance industry capital reached $805 billion by mid-2025, this implies an approximate market share of 14.66% for alternative capital at that time.
RenaissanceRe Holdings Ltd. actively mitigates this substitute threat by managing third-party capital through its Capital Partners division. This strategy turns a competitive force into a revenue stream. For the third quarter of 2025, RenaissanceRe Holdings Ltd. earned $101.8 million in fee income from this segment. This fee income is composed of management and performance fees, which totaled $88.7 million in Q3 2025.
You can see the scale of the third-party capital managed versus the fee generation in the table below. The growth in assets under management (AUM) is defintely a key metric here.
| Metric | Value | Date/Period |
|---|---|---|
| RenaissanceRe Capital Partners Third-Party AUM | $8.54 billion | End of Q3 2025 |
| RenaissanceRe Capital Partners Third-Party AUM | $8.09 billion | June 30th, 2025 |
| RenaissanceRe Q3 2025 Fee Income | $101.8 million | Q3 2025 |
| Outstanding Catastrophe Bond Market Size | $56.7 billion | End of Q2 2025 |
The firm's ability to attract and manage this capital is crucial, as the third-party investor capital under management surpassed the $8 billion milestone for the first time ever at June 30th, 2025.
The value proposition offered by RenaissanceRe Holdings Ltd. against these substitutes centers on proprietary capabilities. The company leverages its superior analytical edge:
- Proprietary risk models offer a superior value proposition over generic capital market products.
- Strong underwriting performance in structures like DaVinci and Vermeer Re drives returns for third-party investors.
- Net income attributable to redeemable noncontrolling interests reached $415.2 million in Q3 2025.
- The overall catastrophe class gross premiums written saw 21.9% underlying growth from Q3 2024.
RenaissanceRe Holdings Ltd. (RNR) - Porter's Five Forces: Threat of new entrants
You're looking at the barriers to entry in the reinsurance space, and honestly, they are formidable, especially when you consider the scale RenaissanceRe Holdings Ltd. (RNR) operates at. New players don't just need a good idea; they need massive, immediate financial backing to even get a seat at the table.
High capital requirement acts as a major barrier, demanding a minimum. For instance, when Beazley announced plans for a new Bermuda platform in late 2025, they allocated $500 million in funding, calling that the 'table stakes' to be a credible market. This aligns with the capital needed for certain established classes; Bermuda Class E reinsurers must maintain total statutory capital and surplus of at least $500,000 (in BMD, which is roughly equivalent to USD in this context for scale) or more, depending on the specific license class, such as the $100 million minimum statutory capital and surplus for a Class 4 insurer.
New entrants face high compliance costs, an annual expense. While direct reinsurance figures are proprietary, the regulatory burden is clear; in related high-regulation financial sectors like pharmaceuticals, the average cost of compliance is reported at $5.47 million annually. You can bet that for a global reinsurer like RenaissanceRe Holdings Ltd. (RNR), which writes $11.7 billion in gross premiums, the actual expense for regulatory adherence, reporting, and solvency management is substantial.
Establishing a credible market reputation takes time. The market is not easily swayed by newcomers; only 50% of the top 15 reinsurers have maintained continuous leadership over the past decade, showing how hard it is just to stay at the top. This suggests that building the trust required to win major treaty business takes many years of consistent, loss-free performance.
RenaissanceRe Holdings Ltd. (RNR)'s scale and established global relationships with brokers and cedants are hard to replicate. In 2024, RenaissanceRe Holdings Ltd. (RNR) relied heavily on the established intermediary network, with three brokerage firms accounting for 82.1% of its gross premiums written. A new entrant would need to spend years building equivalent trust with these gatekeepers.
Access to specialized talent and proprietary data models is a defintely tough hurdle. The industry is characterized by deep expertise. For example, the composite of leading global reinsurers had a cost of equity capital of 9.5% at year-end 2024, meaning any new firm must generate returns significantly above that just to satisfy investors, which requires top-tier talent and models.
Here's a quick look at the scale RenaissanceRe Holdings Ltd. (RNR) commands versus the capital required for a new player in a key market:
| Metric | RenaissanceRe Holdings Ltd. (RNR) Context (2024/2025) | New Entrant Barrier (Bermuda Example) |
|---|---|---|
| Gross Premiums Written (2024) | $11.7 billion | N/A |
| Broker Concentration (2024) | 82.1% via top three brokers | N/A |
| Total Dedicated Reinsurance Capital (Projected 2025) | $649 billion total market | N/A |
| Minimum Credible Funding/Capital | N/A | $500 million funding cited as 'table stakes' |
| Minimum Statutory Capital (Class 4 Insurer) | N/A | $100 million |
The barriers manifest in several ways you need to watch:
- Capitalization must meet or exceed the Enhanced Capital Requirement (ECR).
- Broker relationships are concentrated, with 82.1% dependency for RenaissanceRe Holdings Ltd. (RNR).
- The cost of capital for peers was 9.5% at year-end 2024.
- Maintaining leadership is difficult; only 50% of the top 15 reinsurers sustained it over the last decade.
- Regulatory compliance costs are high, evidenced by industry peers spending around $5.47 million annually in related fields.
Finance: draft 13-week cash view by Friday.
Disclaimer
All information, articles, and product details provided on this website are for general informational and educational purposes only. We do not claim any ownership over, nor do we intend to infringe upon, any trademarks, copyrights, logos, brand names, or other intellectual property mentioned or depicted on this site. Such intellectual property remains the property of its respective owners, and any references here are made solely for identification or informational purposes, without implying any affiliation, endorsement, or partnership.
We make no representations or warranties, express or implied, regarding the accuracy, completeness, or suitability of any content or products presented. Nothing on this website should be construed as legal, tax, investment, financial, medical, or other professional advice. In addition, no part of this site—including articles or product references—constitutes a solicitation, recommendation, endorsement, advertisement, or offer to buy or sell any securities, franchises, or other financial instruments, particularly in jurisdictions where such activity would be unlawful.
All content is of a general nature and may not address the specific circumstances of any individual or entity. It is not a substitute for professional advice or services. Any actions you take based on the information provided here are strictly at your own risk. You accept full responsibility for any decisions or outcomes arising from your use of this website and agree to release us from any liability in connection with your use of, or reliance upon, the content or products found herein.