
|
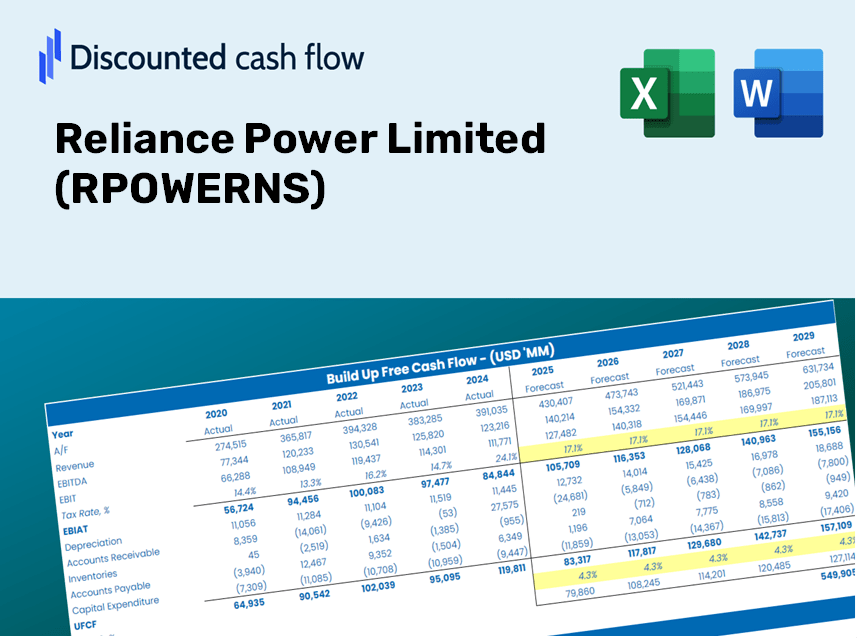
Reliance Power Limited (RPOWER.NS) DCF Valuation |
Fully Editable: Tailor To Your Needs In Excel Or Sheets
Professional Design: Trusted, Industry-Standard Templates
Investor-Approved Valuation Models
MAC/PC Compatible, Fully Unlocked
No Expertise Is Needed; Easy To Follow
Reliance Power Limited (RPOWER.NS) Bundle
Looking to assess the intrinsic value of Reliance Power Limited? Our RPOWERNS DCF Calculator integrates real-world data with comprehensive customization features, enabling you to adjust forecasts and enhance your investment choices.
Discounted Cash Flow (DCF) - (USD MM)
| Year | AY1 2021 |
AY2 2022 |
AY3 2023 |
AY4 2024 |
AY5 2025 |
FY1 2026 |
FY2 2027 |
FY3 2028 |
FY4 2029 |
FY5 2030 |
|---|---|---|---|---|---|---|---|---|---|---|
| Revenue | 79,340.1 | 75,031.1 | 75,139.1 | 78,926.0 | 75,828.9 | 75,912.8 | 75,996.8 | 76,080.8 | 76,165.0 | 76,249.3 |
| Revenue Growth, % | 0 | -5.43 | 0.14394 | 5.04 | -3.92 | 0.11063 | 0.11063 | 0.11063 | 0.11063 | 0.11063 |
| EBITDA | 38,207.1 | 29,394.5 | 20,882.1 | 13,699.3 | 25,955.5 | 25,310.8 | 25,338.8 | 25,366.9 | 25,394.9 | 25,423.0 |
| EBITDA, % | 48.16 | 39.18 | 27.79 | 17.36 | 34.23 | 33.34 | 33.34 | 33.34 | 33.34 | 33.34 |
| Depreciation | 12,930.7 | 12,749.8 | 12,277.2 | 12,567.2 | 10,960.0 | 12,147.0 | 12,160.4 | 12,173.9 | 12,187.3 | 12,200.8 |
| Depreciation, % | 16.3 | 16.99 | 16.34 | 15.92 | 14.45 | 16 | 16 | 16 | 16 | 16 |
| EBIT | 25,276.4 | 16,644.7 | 8,604.9 | 1,132.1 | 14,995.5 | 13,163.9 | 13,178.4 | 13,193.0 | 13,207.6 | 13,222.2 |
| EBIT, % | 31.86 | 22.18 | 11.45 | 1.43 | 19.78 | 17.34 | 17.34 | 17.34 | 17.34 | 17.34 |
| Total Cash | 3,435.0 | 6,737.1 | 2,727.7 | 4,721.5 | 9,733.7 | 5,428.9 | 5,434.9 | 5,440.9 | 5,446.9 | 5,452.9 |
| Total Cash, percent | .0 | .0 | .0 | .0 | .0 | .0 | .0 | .0 | .0 | .0 |
| Account Receivables | 28,753.7 | 41,138.6 | 31,905.9 | 23,739.3 | 21,287.7 | 29,102.5 | 29,134.7 | 29,166.9 | 29,199.2 | 29,231.5 |
| Account Receivables, % | 36.24 | 54.83 | 42.46 | 30.08 | 28.07 | 38.34 | 38.34 | 38.34 | 38.34 | 38.34 |
| Inventories | 8,741.2 | 8,280.4 | 9,253.2 | 9,611.7 | 9,265.8 | 8,922.1 | 8,932.0 | 8,941.9 | 8,951.8 | 8,961.7 |
| Inventories, % | 11.02 | 11.04 | 12.31 | 12.18 | 12.22 | 11.75 | 11.75 | 11.75 | 11.75 | 11.75 |
| Accounts Payable | 4,340.4 | 4,985.8 | 5,191.9 | 4,582.0 | 2,477.3 | 4,266.0 | 4,270.7 | 4,275.4 | 4,280.1 | 4,284.9 |
| Accounts Payable, % | 5.47 | 6.64 | 6.91 | 5.81 | 3.27 | 5.62 | 5.62 | 5.62 | 5.62 | 5.62 |
| Capital Expenditure | -1,339.6 | -1,961.6 | -3,844.9 | -17,691.4 | .0 | -4,833.4 | -4,838.7 | -4,844.1 | -4,849.4 | -4,854.8 |
| Capital Expenditure, % | -1.69 | -2.61 | -5.12 | -22.42 | 0 | -6.37 | -6.37 | -6.37 | -6.37 | -6.37 |
| Tax Rate, % | 3.26 | 3.26 | 3.26 | 3.26 | 3.26 | 3.26 | 3.26 | 3.26 | 3.26 | 3.26 |
| EBITAT | 14,020.8 | 18,244.1 | 14,520.5 | 1,154.6 | 14,506.1 | 11,905.5 | 11,918.7 | 11,931.9 | 11,945.1 | 11,958.3 |
| Depreciation | ||||||||||
| Changes in Account Receivables | ||||||||||
| Changes in Inventories | ||||||||||
| Changes in Accounts Payable | ||||||||||
| Capital Expenditure | ||||||||||
| UFCF | -7,542.6 | 17,753.6 | 31,418.8 | 3,228.6 | 26,158.9 | 13,536.7 | 19,203.1 | 19,224.3 | 19,245.6 | 19,266.9 |
| WACC, % | 7.58 | 10.32 | 10.32 | 10.32 | 10.12 | 9.73 | 9.73 | 9.73 | 9.73 | 9.73 |
| PV UFCF | ||||||||||
| SUM PV UFCF | 68,215.5 | |||||||||
| Long Term Growth Rate, % | 3.50 | |||||||||
| Free cash flow (T + 1) | 19,941 | |||||||||
| Terminal Value | 319,924 | |||||||||
| Present Terminal Value | 201,075 | |||||||||
| Enterprise Value | 269,290 | |||||||||
| Net Debt | 141,797 | |||||||||
| Equity Value | 127,493 | |||||||||
| Diluted Shares Outstanding, MM | 4,096 | |||||||||
| Equity Value Per Share | 31.13 |
What You Will Gain
- Accurate RPOWERNS Financial Data: Pre-loaded with Reliance Power Limited's historical and projected figures for thorough analysis.
- Completely Customizable Template: Easily adjust vital inputs such as revenue growth, WACC, and EBITDA percentage.
- Instant Calculations: Watch Reliance Power Limited's intrinsic value update in real-time as you make changes.
- Expert Valuation Tool: Tailored for investors, analysts, and consultants who need reliable DCF outputs.
- Intuitive User Interface: Streamlined design and straightforward instructions suitable for all skill levels.
Key Features
- Comprehensive DCF Calculator: Features detailed unlevered and levered DCF valuation models tailored for Reliance Power Limited (RPOWERNS).
- WACC Calculator: Includes a pre-built Weighted Average Cost of Capital sheet with adjustable inputs to fit your analysis needs.
- Customizable Forecast Assumptions: Easily adjust growth rates, capital expenditures, and discount rates as per your requirements.
- Integrated Financial Ratios: Assess crucial profitability, leverage, and efficiency ratios specific to Reliance Power Limited (RPOWERNS).
- Interactive Dashboard and Charts: Visual representations that succinctly summarize essential valuation metrics for straightforward analysis.
How It Works
- Download the Template: Gain immediate access to the Excel-based RPOWERNS DCF Calculator.
- Input Your Assumptions: Modify the yellow-highlighted cells for growth rates, WACC, margins, and various factors.
- Instant Calculations: The model will promptly update the intrinsic value of Reliance Power Limited.
- Test Scenarios: Experiment with different assumptions to assess potential changes in valuation.
- Analyze and Decide: Leverage the results to inform your investment or financial evaluations.
Why Opt for the Reliance Power Limited (RPOWERNS) Calculator?
- Time Efficient: Skip the hassle of building a DCF model from the ground up – it’s fully prepared for your use.
- Enhanced Precision: Dependable financial data and established formulas minimize valuation errors.
- Completely Customizable: Adjust the model to align with your specific assumptions and forecasts.
- Simple to Understand: Intuitive charts and outputs make analyzing results straightforward.
- Trusted by Professionals: Crafted for experts who prioritize accuracy and functionality.
Who Should Use This Product?
- Individual Investors: Make well-informed choices regarding the buying or selling of Reliance Power Limited (RPOWERNS) stock.
- Financial Analysts: Enhance your valuation processes with ready-to-implement financial models for Reliance Power Limited (RPOWERNS).
- Consultants: Provide clients with accurate and timely valuation insights for Reliance Power Limited (RPOWERNS).
- Business Owners: Gain an understanding of how large entities like Reliance Power Limited (RPOWERNS) are valued to inform your own business strategies.
- Finance Students: Explore valuation methods using real-world data and scenarios related to Reliance Power Limited (RPOWERNS).
Components of the Template
- Pre-Filled Data: Contains Reliance Power Limited's historical financial performance and projections.
- Discounted Cash Flow Model: Editable DCF valuation model featuring automatic calculations.
- Weighted Average Cost of Capital (WACC): A dedicated sheet for WACC calculation based on user-defined inputs.
- Key Financial Ratios: Evaluate Reliance Power's profitability, operational efficiency, and financial leverage.
- Customizable Inputs: Easily modify revenue growth rates, profit margins, and tax assumptions.
- User-Friendly Dashboard: Visual representations and tables highlighting essential valuation outcomes.
Disclaimer
All information, articles, and product details provided on this website are for general informational and educational purposes only. We do not claim any ownership over, nor do we intend to infringe upon, any trademarks, copyrights, logos, brand names, or other intellectual property mentioned or depicted on this site. Such intellectual property remains the property of its respective owners, and any references here are made solely for identification or informational purposes, without implying any affiliation, endorsement, or partnership.
We make no representations or warranties, express or implied, regarding the accuracy, completeness, or suitability of any content or products presented. Nothing on this website should be construed as legal, tax, investment, financial, medical, or other professional advice. In addition, no part of this site—including articles or product references—constitutes a solicitation, recommendation, endorsement, advertisement, or offer to buy or sell any securities, franchises, or other financial instruments, particularly in jurisdictions where such activity would be unlawful.
All content is of a general nature and may not address the specific circumstances of any individual or entity. It is not a substitute for professional advice or services. Any actions you take based on the information provided here are strictly at your own risk. You accept full responsibility for any decisions or outcomes arising from your use of this website and agree to release us from any liability in connection with your use of, or reliance upon, the content or products found herein.