
|
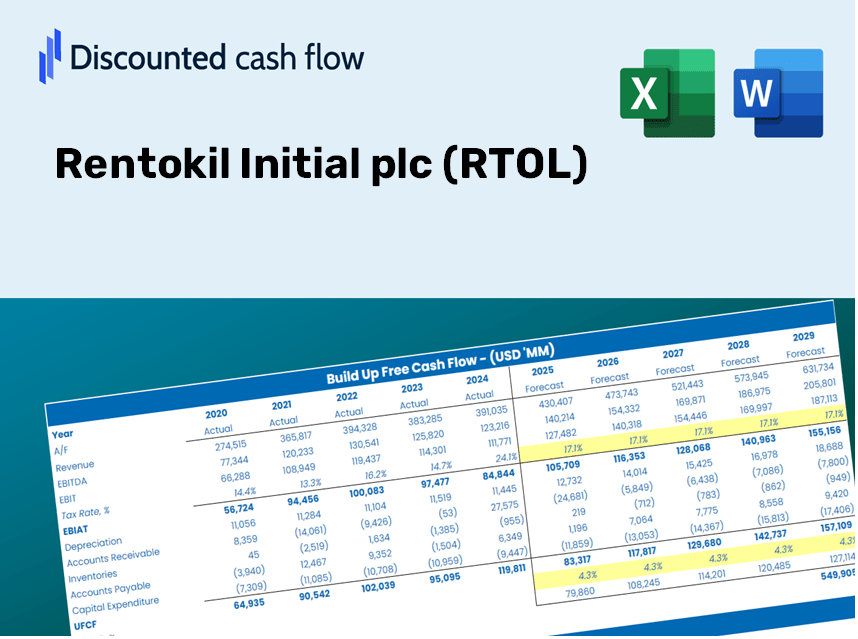
Rentokil Initial plc (RTO.L) DCF Valuation |
Fully Editable: Tailor To Your Needs In Excel Or Sheets
Professional Design: Trusted, Industry-Standard Templates
Investor-Approved Valuation Models
MAC/PC Compatible, Fully Unlocked
No Expertise Is Needed; Easy To Follow
Rentokil Initial plc (RTO.L) Bundle
Optimize your time and improve precision with our (RTOL) DCF Calculator! With real data from Rentokil Initial plc and adjustable assumptions, this tool enables you to forecast, analyze, and assess (RTOL) like a seasoned investor.
Discounted Cash Flow (DCF) - (USD MM)
| Year | AY1 2020 |
AY2 2021 |
AY3 2022 |
AY4 2023 |
AY5 2024 |
FY1 2025 |
FY2 2026 |
FY3 2027 |
FY4 2028 |
FY5 2029 |
|---|---|---|---|---|---|---|---|---|---|---|
| Revenue | 2,789.4 | 2,953.9 | 3,714.0 | 5,375.0 | 5,436.0 | 6,489.0 | 7,746.1 | 9,246.6 | 11,037.9 | 13,176.1 |
| Revenue Growth, % | 0 | 5.9 | 25.73 | 44.72 | 1.13 | 19.37 | 19.37 | 19.37 | 19.37 | 19.37 |
| EBITDA | 586.5 | 676.8 | 747.0 | 1,157.0 | 1,104.0 | 1,374.2 | 1,640.4 | 1,958.2 | 2,337.5 | 2,790.3 |
| EBITDA, % | 21.03 | 22.91 | 20.11 | 21.53 | 20.31 | 21.18 | 21.18 | 21.18 | 21.18 | 21.18 |
| Depreciation | 324.7 | 326.5 | 386.0 | 475.0 | 507.0 | 665.1 | 794.0 | 947.8 | 1,131.4 | 1,350.6 |
| Depreciation, % | 11.64 | 11.05 | 10.39 | 8.84 | 9.33 | 10.25 | 10.25 | 10.25 | 10.25 | 10.25 |
| EBIT | 261.8 | 350.3 | 361.0 | 682.0 | 597.0 | 709.1 | 846.4 | 1,010.4 | 1,206.1 | 1,439.8 |
| EBIT, % | 9.39 | 11.86 | 9.72 | 12.69 | 10.98 | 10.93 | 10.93 | 10.93 | 10.93 | 10.93 |
| Total Cash | 2,340.1 | 597.9 | 2,089.0 | 1,563.0 | 911.0 | 2,676.3 | 3,194.8 | 3,813.6 | 4,552.4 | 5,434.3 |
| Total Cash, percent | .0 | .0 | .0 | .0 | .0 | .0 | .0 | .0 | .0 | .0 |
| Account Receivables | 580.2 | 527.0 | 866.0 | 880.0 | 909.0 | 1,233.6 | 1,472.6 | 1,757.8 | 2,098.3 | 2,504.8 |
| Account Receivables, % | 20.8 | 17.84 | 23.32 | 16.37 | 16.72 | 19.01 | 19.01 | 19.01 | 19.01 | 19.01 |
| Inventories | 131.3 | 135.7 | 200.0 | 207.0 | 229.0 | 295.3 | 352.4 | 420.7 | 502.2 | 599.5 |
| Inventories, % | 4.71 | 4.59 | 5.39 | 3.85 | 4.21 | 4.55 | 4.55 | 4.55 | 4.55 | 4.55 |
| Accounts Payable | 925.0 | 764.0 | 351.0 | 357.0 | 315.0 | 1,050.1 | 1,253.5 | 1,496.3 | 1,786.2 | 2,132.2 |
| Accounts Payable, % | 33.16 | 25.86 | 9.45 | 6.64 | 5.79 | 16.18 | 16.18 | 16.18 | 16.18 | 16.18 |
| Capital Expenditure | -152.5 | -159.9 | -190.0 | -211.0 | -215.0 | -309.9 | -369.9 | -441.6 | -527.1 | -629.2 |
| Capital Expenditure, % | -5.47 | -5.41 | -5.12 | -3.93 | -3.96 | -4.78 | -4.78 | -4.78 | -4.78 | -4.78 |
| Tax Rate, % | 24.2 | 24.2 | 24.2 | 24.2 | 24.2 | 24.2 | 24.2 | 24.2 | 24.2 | 24.2 |
| EBITAT | 211.9 | 283.4 | 282.9 | 527.1 | 452.5 | 557.7 | 665.8 | 794.8 | 948.7 | 1,132.5 |
| Depreciation | ||||||||||
| Changes in Account Receivables | ||||||||||
| Changes in Inventories | ||||||||||
| Changes in Accounts Payable | ||||||||||
| Capital Expenditure | ||||||||||
| UFCF | 597.6 | 337.8 | -337.4 | 776.1 | 651.5 | 1,257.3 | 997.1 | 1,190.3 | 1,420.9 | 1,696.1 |
| WACC, % | 5.37 | 5.37 | 5.34 | 5.32 | 5.3 | 5.34 | 5.34 | 5.34 | 5.34 | 5.34 |
| PV UFCF | ||||||||||
| SUM PV UFCF | 5,572.1 | |||||||||
| Long Term Growth Rate, % | 4.00 | |||||||||
| Free cash flow (T + 1) | 1,764 | |||||||||
| Terminal Value | 131,727 | |||||||||
| Present Terminal Value | 101,561 | |||||||||
| Enterprise Value | 107,133 | |||||||||
| Net Debt | 3,200 | |||||||||
| Equity Value | 103,933 | |||||||||
| Diluted Shares Outstanding, MM | 2,528 | |||||||||
| Equity Value Per Share | 4,111.29 |
What Awaits You
- Flexible Forecast Inputs: Easily adjust assumptions (growth %, margins, WACC) to create various scenarios.
- Actual Financial Data: Rentokil Initial plc’s (RTOL) financial information pre-filled to facilitate your analysis.
- Instant DCF Outputs: The template automatically computes Net Present Value (NPV) and intrinsic value.
- Tailored and Professional: A sleek Excel model designed to fit your valuation requirements.
- Designed for Analysts and Investors: Perfect for analyzing projections, validating strategies, and enhancing efficiency.
Key Features
- Customizable Forecast Inputs: Adjust vital parameters such as revenue growth, operating profit margin, and capital investments.
- Instant DCF Valuation: Quickly computes intrinsic value, net present value (NPV), and other essential financial metrics.
- High Precision Accuracy: Utilizes Rentokil Initial plc (RTOL)’s actual financial data for accurate valuation results.
- Effortless Scenario Analysis: Easily test various assumptions and assess different outcomes.
- Efficiency Booster: Remove the hassle of creating intricate valuation models from the ground up.
How It Works
- Download the Template: Gain immediate access to the Excel-based Rentokil Initial plc (RTOL) DCF Calculator.
- Input Your Assumptions: Modify the yellow-highlighted cells to set growth rates, WACC, margins, and other key factors.
- Instant Calculations: The model will automatically refresh to reflect Rentokil Initial plc's (RTOL) intrinsic value.
- Test Scenarios: Explore various assumptions to assess potential fluctuations in valuation.
- Analyze and Decide: Leverage the findings to inform your investment or financial strategy.
Why Opt for This Calculator?
- Precision: Accurate data derived from Rentokil Initial plc (RTOL) financials.
- Versatility: Built to allow users to easily adjust and test various inputs.
- Efficiency: Eliminate the need to construct a DCF model from the ground up.
- High-Quality: Crafted with the meticulousness and usability suited for CFOs.
- Accessible: Intuitive design makes it simple for users without advanced financial expertise.
Who Can Benefit from This Product?
- Students in Environmental Studies: Explore pest control methods and their impact using real case studies.
- Researchers: Integrate industry best practices into academic papers or projects.
- Facility Managers: Assess treatment options and analyze service outcomes for Rentokil Initial plc (RTOL).
- Environmental Analysts: Optimize your analysis with a ready-to-use, customizable pest management model.
- Property Owners: Understand how major companies like Rentokil Initial plc (RTOL) approach pest management solutions.
What the Template Includes
- Operating and Balance Sheet Data: Pre-filled Rentokil Initial plc (RTOL) historical data and forecasts, featuring revenue, EBITDA, EBIT, and capital expenditures.
- WACC Calculation: A dedicated sheet for calculating the Weighted Average Cost of Capital (WACC), incorporating parameters such as Beta, risk-free rate, and share price.
- DCF Valuation (Unlevered and Levered): Customizable Discounted Cash Flow models that display intrinsic value along with comprehensive calculations.
- Financial Statements: Pre-loaded annual and quarterly financial statements to facilitate thorough analysis.
- Key Ratios: Highlights profitability, leverage, and efficiency ratios specifically for Rentokil Initial plc (RTOL).
- Dashboard and Charts: Visual representation of valuation outputs and assumptions for easy results analysis.
Disclaimer
All information, articles, and product details provided on this website are for general informational and educational purposes only. We do not claim any ownership over, nor do we intend to infringe upon, any trademarks, copyrights, logos, brand names, or other intellectual property mentioned or depicted on this site. Such intellectual property remains the property of its respective owners, and any references here are made solely for identification or informational purposes, without implying any affiliation, endorsement, or partnership.
We make no representations or warranties, express or implied, regarding the accuracy, completeness, or suitability of any content or products presented. Nothing on this website should be construed as legal, tax, investment, financial, medical, or other professional advice. In addition, no part of this site—including articles or product references—constitutes a solicitation, recommendation, endorsement, advertisement, or offer to buy or sell any securities, franchises, or other financial instruments, particularly in jurisdictions where such activity would be unlawful.
All content is of a general nature and may not address the specific circumstances of any individual or entity. It is not a substitute for professional advice or services. Any actions you take based on the information provided here are strictly at your own risk. You accept full responsibility for any decisions or outcomes arising from your use of this website and agree to release us from any liability in connection with your use of, or reliance upon, the content or products found herein.