
|
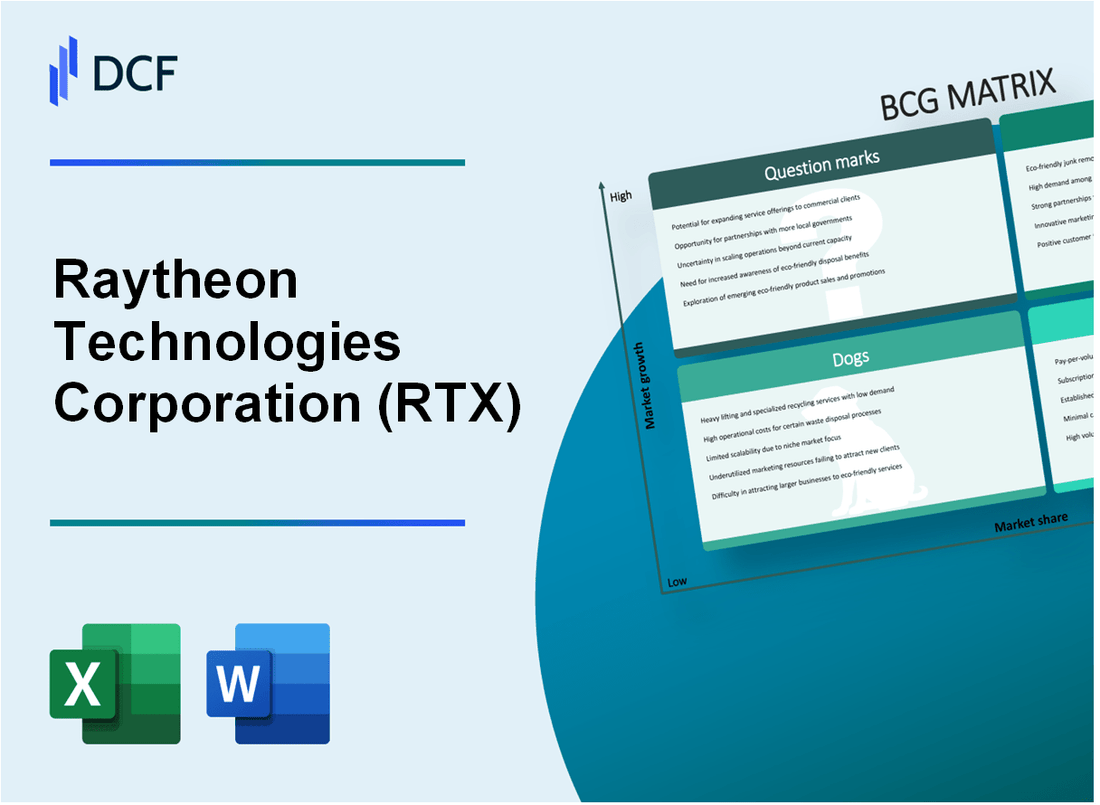
Raytheon Technologies Corporation (RTX): BCG Matrix [Dec-2025 Updated] |
Fully Editable: Tailor To Your Needs In Excel Or Sheets
Professional Design: Trusted, Industry-Standard Templates
Investor-Approved Valuation Models
MAC/PC Compatible, Fully Unlocked
No Expertise Is Needed; Easy To Follow
Raytheon Technologies Corporation (RTX) Bundle
You're looking at Raytheon Technologies Corporation (RTX) right now, and the picture is sharp: where's the money flowing, and what's eating up cash as we close out 2025? We've mapped their portfolio, showing how high-demand defense systems and a booming aftermarket are lighting up the 'Stars' quadrant, while mature programs keep the lights on, projecting a Free Cash Flow between $7.0 billion and $7.5 billion for the year. But honestly, the real story is the tension-massive investments into next-gen tech clash with the ongoing, costly fix for the Geared Turbofan engine, which alone is hitting 2025 cash by about $1.5 billion. Let's break down exactly which units are driving growth and which are draining resources so you can see the strategic path forward.
Background of Raytheon Technologies Corporation (RTX)
You're looking for the foundation of RTX, and it's a story of two giants coming together. RTX Corporation, as you know it now, is an American aerospace and defense manufacturer headquartered in Arlington, Virginia. It officially became RTX in July 2023, having previously been known as Raytheon Technologies Corporation since its formation in April 2020.
That 2020 formation was the result of a massive combination between the Raytheon Company and the aerospace businesses spun off from United Technologies Corporation. Honestly, the roots go way back; the original Raytheon Company started in 1922 in Cambridge, Massachusetts, initially focusing on electronics like vacuum tubes.
Today, RTX operates through three principal businesses: Collins Aerospace, Pratt & Whitney, and Raytheon-this last one being a consolidation of the former Intelligence & Space and Missiles & Defense units from 2023. The company is a powerhouse, employing approximately 185,000 global workers as of late 2025, and it posted sales exceeding $80 billion for the full year 2024.
To ground this in the present, you should know that the leadership shifted recently, with Christopher T. Calio taking the CEO role in May 2024 and later becoming chairman in 2025. For the near term, RTX reported third-quarter 2025 adjusted sales of $22.5 billion, leading them to raise the full-year 2025 adjusted sales guidance to a range between $84.75 billion and $85.5 billion.
Raytheon Technologies Corporation (RTX) - BCG Matrix: Stars
Stars are defined by having high market share in a growing market. Raytheon Technologies Corporation (RTX) exhibits several business units fitting this profile, representing areas where significant investment is warranted to maintain leadership as markets mature.
The overall RTX performance in the third quarter of fiscal year 2025 reflects this strength, with reported sales of $22.5 billion, marking a 12% year-over-year increase, or 13% organically, excluding divestitures. The total company backlog stood at $251 billion at the end of Q3 2025.
Raytheon's Integrated Air and Missile Defense
This unit, part of the Raytheon segment, shows high demand driven by geopolitical conflict, with its Q3 2025 sales reaching $7 billion, a 10% year-over-year growth. Key products are clear market leaders in high-growth defense spending areas.
- Standard Missile-6 (SM-6) received a $333 million U.S. Navy contract in January 2025 for SM-6 Block IA production, with completion expected by 2027.
- The Patriot system is cited as a driver for the segment's Q3 2025 growth.
- The SM-6 is the only missile supporting anti-air, anti-surface warfare, and sea-based terminal ballistic missile defense in one solution.
Collins Aerospace Commercial Aftermarket
This area demonstrates strong market penetration supported by a massive installed base. The segment reported overall organic sales growth of 11% in Q3 2025. The specific commercial aftermarket sub-segment saw a 13% increase in sales.
The installed base is a key enabler for this growth, with more than $100 billion of out of warranty content at Collins Aerospace. This positions the aftermarket for sustained revenue as the installed fleet ages and requires maintenance.
Pratt & Whitney Military Engines (e.g., F135 for F-35)
As the sole engine provider for the F-35 Lightning II program, Pratt & Whitney Military Engines holds a high-share position in a high-growth global defense market. Military programs within the segment saw a 15% growth in Q3 2025.
Sustainment is a major cash flow driver, with a recent undefinitized contract action awarded in December 2025 valued at $1.6 billion to sustain the F135 engines. To date, over 1,300 F135 production engines have been delivered to a global enterprise spanning 20 allied nations.
Advanced Radar Systems (AN/SPY-6)
The AN/SPY-6 family operates in a high-growth defense electronics market, securing major contracts. In June 2025, Raytheon was awarded a $646 million contract for hardware production and sustainment of the AN/SPY-6(V) radars for the U.S. Navy.
This award was the fourth option exercised from a broader March 2022 contract valued up to $3 billion over five years. This latest award increases the total number of SPY-6 radars under contract for procurement to 42 units.
Here's a quick look at some of the key financial and statistical data supporting the Star categorization for these units as of late 2025:
| Business Unit/Product | Metric | Value/Amount | Timeframe/Context |
| RTX (Total Company) | Organic Sales Growth | 13% | Q3 2025 |
| Raytheon Segment | Quarterly Sales | $7 billion | Q3 2025 |
| SM-6 Block IA | U.S. Navy Contract Value | $333 million | January 2025 |
| Collins Aerospace Commercial Aftermarket | Sales Growth | 13% | Q3 2025 |
| Collins Aerospace Segment | Organic Sales Growth | 11% | Q3 2025 |
| F135 Military Engines | Sustainment Contract Value | $1.6 billion | December 2025 |
| F135 Engines Delivered | Total Units Delivered | More than 1,300 | As of March 2025 |
| AN/SPY-6 Radar | New Production Contract Award | $646 million | June 2025 |
| AN/SPY-6 Radar | Total Radars Under Contract | 42 | As of June 2025 |
Raytheon Technologies Corporation (RTX) - BCG Matrix: Cash Cows
You're analyzing the core stability of Raytheon Technologies Corporation (RTX), and the Cash Cows quadrant is where the reliable, mature businesses live. These units have a strong grip on their market and generate the necessary cash to fund the rest of the company's ambitions. Honestly, this is the bedrock of the balance sheet.
Collins Aerospace Original Equipment (OE)
Collins Aerospace Original Equipment (OE) represents a stable, high-share provider position within established aircraft platforms. For the third quarter of 2025, this business saw its commercial original equipment component contribute to an overall 8 percent year-over-year sales increase for the segment, which reported sales of $7,621 million. The company raised its full-year 2025 organic sales growth guidance, which reflects the strength across its commercial lines. You want to see this segment maintain its high share because it supports the larger aftermarket business down the line. It's a steady earner, even if the growth rate isn't explosive.
- Collins Aerospace Q3 2025 Sales: $7.621 billion
- Commercial OE sales increase in Q3 2025: 16 percent
- Collins Aerospace Commercial Aftermarket growth in Q3 2025: 13 percent
Pratt & Whitney Legacy Aftermarket
The Pratt & Whitney Legacy Aftermarket, focusing on maintenance, repair, and overhaul (MRO) for mature engines, is a classic cash cow. The V2500 engine fleet, for instance, is mature, and shop visits are expected to remain steady. Pratt & Whitney forecasts commercial aftermarket sales growth to be in the mid-teens for the full year 2025. In the third quarter of 2025, the overall aftermarket sales for Pratt & Whitney jumped by a significant 23 percent. The V2500 engine program is projected to see around 800 shop visits in 2025, providing a predictable stream of high-margin MRO revenue. This service work is less cyclical than new engine sales, which is exactly what you want from a cash cow.
Core Defense Programs
The Raytheon segment, which houses the Core Defense Programs, provides long-term, stable cash flow through established weapons and sensors contracts. This stability is underpinned by the massive defense order book. As of the third quarter of 2025, the defense segment backlog stood at $103 billion. The Raytheon business segment itself reported sales of $7 billion in Q3 2025, marking a 10 percent year-over-year increase, driven by higher volumes on key programs like Patriot. The segment achieved a book-to-bill ratio of 1.43 for the rolling 12-month period, showing it is booking more than it is delivering over that time, which secures future cash flow.
Here's a quick look at the key financial anchors supporting the Cash Cow status for Raytheon Technologies Corporation as of the latest reporting:
| Financial Metric | Value/Range | Source Context |
| Defense Segment Backlog | $103 billion | Q3 2025 Defense Segment Backlog |
| Total Company Backlog | $251 billion | Record Backlog as of Q3 2025 |
| Q3 2025 Operating Cash Flow | $4.6 billion | Reported for the Third Quarter 2025 |
| Q3 2025 Free Cash Flow | $4.0 billion | Reported for the Third Quarter 2025 |
| Full Year 2025 FCF Guidance | $7.0 billion-$7.5 billion | Full Year 2025 Projection |
Overall RTX Financial Stability
The collective performance of these high-share, mature businesses allows Raytheon Technologies Corporation to project a very healthy cash position. The company expects to deliver a robust Free Cash Flow of $7.0 billion-$7.5 billion for the full year 2025. This strong cash generation is vital; it's the money used to cover corporate overhead, pay dividends, and fund the development of those riskier Question Marks. In the third quarter alone, the company generated $4.0 billion in free cash flow, more than covering the $0.6 billion in capital expenditures. This cash flow conversion is what makes the Cash Cows so valuable to your analysis. Finance: draft 13-week cash view by Friday.
Raytheon Technologies Corporation (RTX) - BCG Matrix: Dogs
Dogs are business units or product lines characterized by low market share in markets experiencing low growth. For Raytheon Technologies Corporation (RTX), the strategy around these assets is clearly one of divestiture and minimization, freeing up capital for Stars and Cash Cows.
Divested/Streamlined Businesses
You've seen the aggressive streamlining in action. The completion of the divestiture of Collins' actuation and flight control business occurred in the third quarter of 2025. This move was significant enough that the reported operating profit for Collins Aerospace in Q3 2025 included a gain on the sale of this business. Furthermore, the impact of exiting non-core areas is visible in the segment sales figures. For instance, Raytheon segment sales in Q1 2025 were reported down 5 percent year-over-year, which RTX explicitly attributed to the divestiture of its cybersecurity, intelligence and services business, which was completed in Q1 2024. Excluding that divestiture, Q1 2025 sales were up 2 percent organically.
- Completed divestiture of Collins actuation and flight control business in Q3 2025.
- Prior divestiture of Cybersecurity, Intelligence and Services business impacted Q1 2025 sales by 5 percent decline.
- Divestitures allow focus on core, higher-growth areas like international Patriot and naval programs.
Legacy IT and Services
The legacy IT and Services category represents the type of low-share, low-growth contracts that fit the Dog profile perfectly. These are non-strategic assets where expensive turn-around plans rarely pay off. While the major services unit was divested, the characteristics of a Dog segment are illustrated by data points associated with older technology areas. For example, in analyses of legacy defense technologies, one might find an obsolete radar systems market share as low as 2.9%, generating annual revenue around $287 million, with a projected market contraction rate of 2.3% annually. These are the exact financial profiles that necessitate divestiture rather than sustained investment.
Mature, Low-Volume Defense Platforms
Even within the core defense segment, some older platforms fall into this category due to minimal follow-on orders or declining budget priority compared to next-generation systems. In Raytheon's Q2 2025 results, the overall segment sales growth was partially offset by what management noted as lower development program volume within air and space defense systems. This indicates specific, mature platforms within that sub-segment are not capturing the high growth seen elsewhere, such as in international Patriot or NASAMS programs, which saw higher volume.
Here's a look at the financial context surrounding the streamlining actions:
| Metric | Value/Impact | Timeframe/Context |
| Collins Actuation & Flight Control Divestiture | Resulted in a gain on sale included in Q3 operating profit | Q3 2025 |
| Cybersecurity, Intelligence & Services Divestiture Impact | 5 percent drop in Raytheon segment sales | Q1 2025 (Excluding it, sales grew 2 percent) |
| Legacy Tech Revenue (Example) | Approximately $287 million | Characteristic of a Dog segment |
| Legacy Tech Market Contraction (Example) | 2.3 percent annually | Characteristic of a Dog market |
| Air & Space Defense Volume | Lower development program volume cited as a headwind | Q2 2025 |
These actions confirm that RTX is actively managing down its exposure to low-return assets, which is the textbook approach for the Dogs quadrant. You want to avoid tying up cash in areas that won't generate meaningful returns.
Raytheon Technologies Corporation (RTX) - BCG Matrix: Question Marks
You're looking at the parts of Raytheon Technologies Corporation (RTX) that are in high-growth markets but haven't yet captured a commanding market share. These are the units that burn cash now, hoping to become tomorrow's Stars. Honestly, they require a clear decision: invest heavily or divest.
Pratt & Whitney Geared Turbofan (GTF) Original Equipment (OE)
The market for engines powering newer narrow-body aircraft, like the A320neo family, is growing, but the GTF engine program has a lower relative share, cited at approximately 40%. This segment is characterized by high market growth potential but is currently weighed down by significant technical risk and associated costs. For instance, in the third quarter of fiscal year 2025, Pratt & Whitney commercial Original Equipment (OE) sales saw a rise of 5% year-over-year, while in the first quarter of 2025, commercial OE sales rose by 3%. The overall Pratt & Whitney segment reported sales of $8.4 billion in Q3 2025.
GTF Powder Metal Issue
The ongoing powder metal manufacturing issue within the GTF fleet requires massive, ongoing investment and customer compensation. RTX expects a cash impact of approximately $1.5 billion during 2025, which results in an estimated RTX 2025 free cash flow of approximately $7.5 billion. The gross financial impact of the issue soared to between $6.0 billion and $7.0 billion as of September 2023, with rework extending well into 2026. This situation consumes significant cash flow that could otherwise be allocated elsewhere.
Hypersonics and Directed Energy
These next-generation defense markets represent high growth but require substantial, ongoing Research and Development (R&D) investment with uncertain near-term market share capture. Raytheon Technologies Corporation (RTX) holds a significant share, over 15%, in the Hypersonic Weapons Market, which was valued at $7.12 billion in 2023 and is expected to grow at a Compound Annual Growth Rate (CAGR) of over 10% through 2032. RTX invested $1.2 billion in hypersonic technology R&D for 2024. The Directed Energy Weapons (DEW) market is projected to grow from $7.01 billion in 2024 to $8.76 billion in 2025, a CAGR of 25.1%, or potentially to $10.3 billion in 2025 from $8.9 billion in 2024, at a CAGR of 15.2%.
The investment and market dynamics for these defense technologies can be summarized as follows:
- Hypersonic Weapons Market Size (2023): $7.12 billion
- Directed Energy Weapons Market Size (2025 Estimate): $8.76 billion to $10.3 billion
- Directed Energy CAGR (2024-2025): 25.1% or 15.2%
- RTX Hypersonic R&D Investment (2024): $1.2 billion
- US DoD Sanctioned for DEW Advancements (2024): $1.1 billion
New Commercial OE Programs
Any new engine or airframe component programs in the development phase fall here, demanding heavy capital outlay before proven market adoption. These nascent programs consume cash while building market presence. RTX invested over $600 million in manufacturing expansion projects in 2025 year-to-date (through Q3). The commercial OE segment is growing, with Q1 2025 sales up 3% and Q3 2025 sales up 5%.
Here's a quick look at the growth context for these new programs:
| Metric | Value | Source Segment |
|---|---|---|
| Commercial OE Sales Growth (Q1 2025) | 3% | Pratt & Whitney |
| Commercial OE Sales Growth (Q3 2025) | 5% | Pratt & Whitney |
| Total Manufacturing Expansion Investment (YTD 2025) | Over $600 million | RTX |
Disclaimer
All information, articles, and product details provided on this website are for general informational and educational purposes only. We do not claim any ownership over, nor do we intend to infringe upon, any trademarks, copyrights, logos, brand names, or other intellectual property mentioned or depicted on this site. Such intellectual property remains the property of its respective owners, and any references here are made solely for identification or informational purposes, without implying any affiliation, endorsement, or partnership.
We make no representations or warranties, express or implied, regarding the accuracy, completeness, or suitability of any content or products presented. Nothing on this website should be construed as legal, tax, investment, financial, medical, or other professional advice. In addition, no part of this site—including articles or product references—constitutes a solicitation, recommendation, endorsement, advertisement, or offer to buy or sell any securities, franchises, or other financial instruments, particularly in jurisdictions where such activity would be unlawful.
All content is of a general nature and may not address the specific circumstances of any individual or entity. It is not a substitute for professional advice or services. Any actions you take based on the information provided here are strictly at your own risk. You accept full responsibility for any decisions or outcomes arising from your use of this website and agree to release us from any liability in connection with your use of, or reliance upon, the content or products found herein.