
|
Revolution Medicines, Inc. (RVMD): 5 FORCES Analysis [Nov-2025 Updated] |
Fully Editable: Tailor To Your Needs In Excel Or Sheets
Professional Design: Trusted, Industry-Standard Templates
Investor-Approved Valuation Models
MAC/PC Compatible, Fully Unlocked
No Expertise Is Needed; Easy To Follow
Revolution Medicines, Inc. (RVMD) Bundle
You're looking to map out the competitive forces shaping Revolution Medicines, Inc.'s (RVMD) future, which is smart given their deep investment in the high-stakes RAS-addicted cancer space. Honestly, the picture is complex: the company is burning serious capital, with their full-year 2025 net loss guidance sitting between \$1.03 billion and \$1.09 billion, while simultaneously fighting extremely high rivalry in the KRAS inhibitor market and managing the high power of specialized suppliers for their APIs. We need to see exactly where the pressure is coming from-whether it's payers demanding discounts or the high regulatory hurdles keeping new entrants out-to understand the true risk/reward profile of their assets like daraxonrasib. Read on for the full Five Forces breakdown.
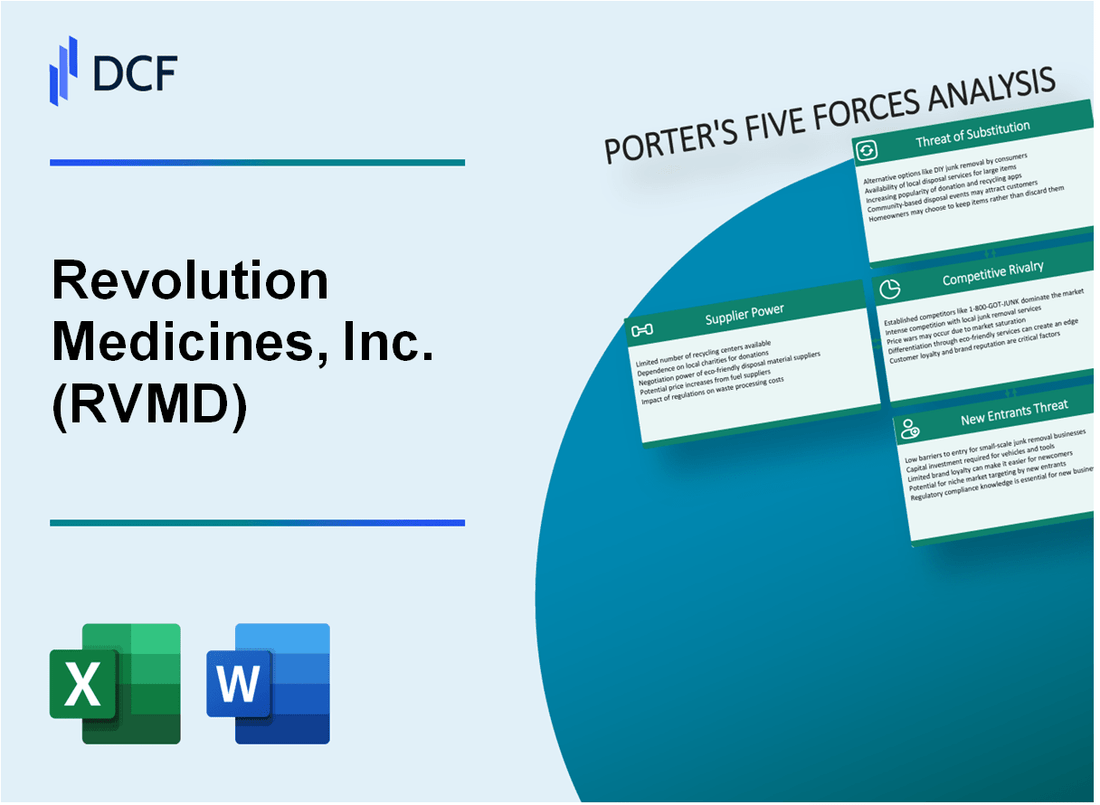
Revolution Medicines, Inc. (RVMD) - Porter's Five Forces: Bargaining power of suppliers
For Revolution Medicines, Inc. (RVMD), the bargaining power of suppliers leans toward the high side, a common characteristic for clinical-stage biotechs developing novel, complex therapies. You see this pressure reflected in their operational spending.
The core issue stems from the absolute reliance on specialized Contract Manufacturing Organizations (CMOs) for producing both the drug substance and the drug product for their pipeline candidates, including daraxonrasib, elironrasib, and zoldonrasib. Currently, all of Revolution Medicines, Inc.'s manufacturing is outsourced to these well-established third-party manufacturers. This dependence means that the CMOs control the process development, cGMP (current Good Manufacturing Practice) compliance, and ultimate supply of clinical trial materials.
The complexity of the RAS(ON) inhibitor platform-which involves proprietary tri-complex technology to target the active form of RAS-narrows the field of capable partners significantly. This specialized chemistry suggests a limited number of global suppliers possess the requisite expertise for complex, novel oncology drug synthesis, thereby increasing their leverage over Revolution Medicines, Inc.
The financial commitment to this outsourced function is substantial, as evidenced by the company's recent spending:
| Financial Metric | Amount / Period | Context |
|---|---|---|
| Research and Development Expenses | $262.5 million / Q3 2025 | Reflects significant capital commitment to clinical supply and manufacturing activities. |
| R&D Expenses Year-over-Year Increase | 73% (from $151.8 million in Q3 2024) | Driven by higher clinical trial and manufacturing expenses. |
| Cash and Investments | $1.93 billion / September 30, 2025 | Strong cash position, but high burn rate necessitates reliable supply. |
| Full Year 2025 GAAP Net Loss Guidance | Between $1.03 billion and $1.09 billion | High operational costs, including manufacturing, contribute to the net loss. |
While Revolution Medicines, Inc.'s intellectual property (IP) surrounding its unique RAS(ON) platform provides significant leverage in the market against competitors, it does not fully mitigate supplier risk. In fact, the company has noted that some of its third-party suppliers are currently its sole source for drug supplies, including key starting and intermediate materials. An issue with one of these sole-source suppliers could directly impact development timelines and commercial plans.
The supplier power dynamic is characterized by several key dependencies:
- Reliance on CMOs for both drug substance and drug product.
- Risk of sole-source suppliers for key starting materials.
- Need for process development compliant with cGMP standards.
- Potential for delays if scale-up by third parties is insufficient.
Revolution Medicines, Inc. (RVMD) - Porter's Five Forces: Bargaining power of customers
You're analyzing Revolution Medicines, Inc. (RVMD) as it approaches potential commercialization for its lead assets. The power wielded by the entities paying for your drugs-the customers-is split, creating a complex dynamic you need to navigate.
For individual oncologists, the power is relatively low, leaning toward moderate. This is because Revolution Medicines, Inc.'s pipeline, centered on daraxonrasib, targets RAS-addicted cancers, which represent a significant unmet medical need. For instance, RAS mutations are found in approximately 90% of pancreatic ductal adenocarcinoma (PDAC) cases and 30% of non-small cell lung cancer (NSCLC) cases, translating to hundreds of thousands of patients annually in the U.S. alone. When a drug shows efficacy in a setting with limited alternatives, the prescribing physician's leverage to demand concessions from the manufacturer is minimal; their primary focus is patient outcome.
However, the power shifts dramatically when you look at the large payers-the insurers and government programs. These entities hold high bargaining power. This is standard for high-cost specialty oncology drugs, and the trend in 2025 shows oncology drug spend remains a top payer priority. Payers are actively seeking better value for healthcare spend.
The sheer cost of novel cancer therapies fuels this pressure. In 2023, the U.S. spent $99 billion on orally- and clinician-administered anticancer therapies, a figure projected to hit $180 billion by 2028. Furthermore, 95% of new anticancer therapies launched in 2023 had annual launch prices exceeding $100,000. To counter this, large payers employ strict management tactics. Here's a quick look at common payer oversight strategies for medical benefit drugs:
| Payer Management Strategy | Percentage of Plans Using Strategy (2025 Data) |
|---|---|
| Medical Policy | 76% |
| Guidelines | 64% |
| Step Therapy (for preferred products) | 58% |
| Pathways | 52% |
The receipt of the FDA Commissioner's National Priority Voucher (CNPV) for daraxonrasib in October 2025 is a double-edged sword regarding customer power. While the voucher recognizes the large unmet need and could expedite review, potentially accelerating market entry, it doesn't insulate the drug from intense pricing scrutiny upon launch. The fact that the program was established underscores the national priority to address these high-cost areas, which means payers will be watching the final negotiated price closely, especially given the new Medicare price negotiation framework under the Inflation Reduction Act (IRA).
The initial willingness to pay from the patient base, which directly influences payer calculus, is initially high due to the lack of alternatives for specific RAS mutations. For example, Revolution Medicines is advancing daraxonrasib in Phase 3 trials for previously treated metastatic pancreatic cancer, a disease where 90% of cases have RAS mutations.
The market access environment for Revolution Medicines, Inc. is defined by these key customer dynamics:
- Individual oncologists have low leverage due to high unmet need in RAS-addicted cancers.
- Large payers exert high power, demanding value for high-cost specialty oncology drugs.
- The CNPV for daraxonrasib signals regulatory recognition but not pricing immunity.
- The company is projecting a full-year 2025 GAAP net loss between $1.03 billion and $1.09 billion, meaning successful pricing negotiations are critical to future financial health.
- Payer management tools like step therapy (58% usage) will be deployed to control access to new, high-priced therapies.
Finance: draft initial payer access strategy document for daraxonrasib by end of Q1 2026.
Revolution Medicines, Inc. (RVMD) - Porter's Five Forces: Competitive rivalry
You're analyzing the competitive landscape for Revolution Medicines, Inc. (RVMD), and the rivalry in the targeted oncology space, particularly for KRAS inhibitors, is fierce. This isn't a quiet market; it's a high-stakes race for first-in-class or best-in-class status against established giants and well-funded biotechs. Honestly, the pressure is immense, but the potential payoff for a successful asset is huge.
The overall KRAS inhibitor market is estimated to be valued at an estimated $109.9 million in 2025, though other market reports place the 2025 valuation closer to $118.26 million. Regardless of the exact figure, the market is nascent but growing, projected to reach $156.7 million by 2032 at a CAGR of 5.2%, according to one estimate. This growth trajectory attracts significant competitive focus.
Direct competition comes from approved KRAS G12C inhibitors that have already secured market share and physician adoption. Amgen's Lumakras (sotorasib) and Bristol Myers Squibb's Krazati (adagrasib) are the established players here. You can see the revenue flow, which indicates the current market penetration:
- Amgen's Lumakras (sotorasib) Q3 2025 sales were $96 million, following Q2 2025 sales of $90 million and Q1 2025 sales of $85 million.
- Bristol Myers Squibb's Krazati (adagrasib) achieved sales of $48 million in Q1 2025, representing a 125% surge year-over-year.
This direct competition forces Revolution Medicines, Inc. to differentiate its pipeline assets, especially since its G12C-selective inhibitor, Elironrasib (RMC-6291), is entering a space with established products. Elironrasib itself showed a 56% objective response rate (ORR) in NSCLC patients previously treated with chemotherapy and immunotherapy.
The competition for the G12D mutation, where Revolution Medicines, Inc. has Zoldonrasib (RMC-9805), is also intense, though less crowded with approved drugs. You have Mirati's MRTX1133 and Roche's Divarasib vying for position, though the landscape is shifting. Mirati Therapeutics Inc.'s Phase 1/2 study for MRTX1133 was terminated prior to Phase 2 initiating. Still, Zoldonrasib is showing promising early signals, posting a 61% ORR and 89% DCR in NSCLC patients.
Here's a quick look at how the pipeline assets stack up in terms of reported efficacy, keeping in mind these are often from different trial settings:
| Investigational Drug | Target Mutation | Indication/Setting | Objective Response Rate (ORR) | Median Progression-Free Survival (PFS) |
| Zoldonrasib (RVMD) | G12D-selective | NSCLC | 61% | Not explicitly stated for this cohort |
| Zoldonrasib (RVMD) | G12D-selective | PDAC | 30% | Not explicitly stated for this cohort |
| Divarasib (Roche) | G12C-selective | NSCLC (Phase I) | 53.4% | 13.1 months |
| Daraxonrasib (RVMD Lead) | Multi-selective | 1L Metastatic PDAC (n=38) | 47% | Not explicitly stated for this cohort |
Revolution Medicines, Inc.'s multi-selective inhibitor, daraxonrasib, is their key differentiator, aiming for a broader pan-RAS market which could reduce direct rivalry with single-mutation drugs. Daraxonrasib has shown a median PFS of 8.8 months in previously treated metastatic PDAC and 9.8 months in second/third-line NSCLC. The company is pushing this asset aggressively, with a strong financial foundation of $1.93 billion in cash, cash equivalents, and marketable securities as of September 30, 2025, bolstered by a $250 million royalty monetization tranche. This cash runway supports the high R&D spend, which reached $262.5 million in Q3 2025, as they push toward data readouts expected in 2026. The strategy is clear: use the multi-selectivity to carve out a unique space while competitors fight over the G12C and G12D niches.
Revolution Medicines, Inc. (RVMD) - Porter's Five Forces: Threat of substitutes
You're looking at the competitive landscape for Revolution Medicines, Inc. (RVMD), and the threat of substitutes is definitely a major factor, especially given the high unmet need in RAS-addicted cancers. The existing standard-of-care (SOC) treatments, even if suboptimal, set a baseline that any new therapy must significantly surpass to gain traction.
The threat from established regimens is high. For instance, in second-line pancreatic ductal adenocarcinoma (PDAC) patients with KRAS G12X mutations, the median progression-free survival (PFS) seen with Revolution Medicines' daraxonrasib was 8.1 months in an earlier analysis. This needs to be weighed against the benchmark median PFS for current SOC chemotherapy regimens in that setting, which historically range from 2 months to 3.5 months. Revolution Medicines is actively planning its registrational trial, RASolute 303, to directly compare daraxonrasib, both as monotherapy and in combination with gemcitabine nab-paclitaxel (GnP), against GnP alone in first-line metastatic PDAC.
The competitive field is not just about existing drugs; it's about novel modalities emerging as substitutes. This includes non-small molecule approaches. We are seeing engineered T-cell receptors (TCRs) advance, such as AstraZeneca's TGFBR2 KO armored TCR-T targeting KRAS G12D, which commenced a Phase I trial in the third quarter of 2025. Furthermore, the same mRNA technology that gained prominence recently is being applied to cancer vaccines, which are advancing rapidly.
To effectively compete against established protocols, Revolution Medicines, Inc. must often demonstrate superiority in combination. The company is pursuing this by mixing its RAS(ON) inhibitors with other agents, notably PD-1 inhibitors like pembrolizumab. Data shared as of February 10, 2025, for ten patients in the first-line non-small cell lung cancer (NSCLC) setting treated with daraxonrasib and pembrolizumab showed an objective response rate (ORR) of 100% among five efficacy-evaluable patients with a high PD-L1 score (TPS $\ge$ 50%).
Here is a quick comparison of Revolution Medicines' data against the historical context for second-line PDAC:
| Treatment/Regimen | Patient Population Context | Median Progression-Free Survival (PFS) |
|---|---|---|
| Daraxonrasib (Monotherapy) | Previously treated metastatic PDAC (KRAS G12X) | 8.1 months |
| Standard Chemotherapy (Historical Benchmark) | Previously treated metastatic PDAC | 2 months to 3.5 months |
Still, the threat is significantly mitigated by the sheer scale of the problem Revolution Medicines, Inc. is addressing. The high unmet need in RAS-mutated cancers, where current treatments frequently fail, provides a substantial runway for effective novel agents. Consider the prevalence:
- KRAS mutations are found in approximately 90% of pancreatic ductal adenocarcinoma (PDAC) cases.
- Approximately 30% of non-small cell lung cancer (NSCLC) cases harbor RAS mutations.
- Overall, roughly 19% of all cancer patients harbor RAS mutations, translating to about 3.4 million new cases per year worldwide.
The company is investing heavily to outpace these substitutes, reporting R&D expenses of $262.5 million for the third quarter of 2025, as it pushes its pipeline forward from a strong cash position of $1.93 billion at the end of Q3 2025. This aggressive spending is necessary to establish its RAS(ON) inhibitors as the new standard, despite the projected full-year 2025 GAAP net loss guidance being between $1.03 billion and $1.09 billion.
Finance: review Q4 2025 cash burn rate against the $1.93 billion Q3 ending balance by next Wednesday.
Revolution Medicines, Inc. (RVMD) - Porter's Five Forces: Threat of new entrants
You're looking at the barriers to entry in the precision oncology space, and honestly, for a company like Revolution Medicines, Inc., they are formidable. The threat of new entrants isn't high because the sheer scale of investment required acts as a massive moat.
Consider the capital burn. Revolution Medicines, Inc. is projecting a full-year 2025 GAAP net loss guidance that falls between $1.03 billion and $1.09 billion. That level of sustained, multi-year negative cash flow before a product generates revenue is a huge hurdle for any startup to clear. To put that burn in context, their third quarter ended September 30, 2025, already showed a net loss of $305.2 million, driven by $262.5 million in Research & Development Expenses. This financial reality means a new competitor needs access to billions in funding just to keep pace with ongoing operations, let alone fund the necessary clinical pipeline advancement.
The regulatory gauntlet is another significant deterrent. Getting a novel therapy through the U.S. Food and Drug Administration (FDA) is a multi-year, multi-million dollar endeavor. You're not just looking at the operational cost of the trials; you're looking at direct filing fees. For fiscal year 2025, the cost to file a New Drug Application (NDA) requiring clinical data is set to be $4.3 million. But that's just the fee; the trials themselves are the real expense. Phase 3 trials, which Revolution Medicines, Inc. is currently running with daraxonrasib, typically cost anywhere from $20 million to over $100 million per study, with 2024 averages for Phase 3 trials landing around $36.58 million. Plus, the timeline from Investigational New Drug (IND) filing to FDA submission has historically averaged 89.8 months for recent approvals. That's a long time to operate without revenue.
Here's a quick look at the financial scale involved in this high-stakes game:
| Financial Metric/Cost Component | Amount/Range (2025 Data) |
| Revolution Medicines, Inc. Full-Year 2025 Net Loss Guidance | $1.03 billion to $1.09 billion |
| Revolution Medicines, Inc. Cash Position (as of June 30, 2025) | $2.1 billion |
| Estimated Non-Cash Stock-Based Comp. (Part of 2025 Loss) | $115 million to $130 million |
| Average Phase 3 Clinical Trial Cost (Completed in 2024) | $36.58 million |
| FDA Drug Application Fee (With Clinical Data, FY 2025) | $4.3 million |
The technological barrier is perhaps the highest wall. Revolution Medicines, Inc.'s core value rests on its proprietary RAS(ON) tri-complex inhibitor platform. This approach targets the active, GTP-bound state of oncogenic RAS proteins, which were long considered undruggable. Successfully creating small molecules that drive the high-affinity ternary complex (tri-complex) between the target protein, the small molecule, and a chaperone like cyclophilin A requires deep, specialized knowledge. A new entrant can't just license a known compound; they need to replicate this complex, novel discovery engine.
To even attempt to compete in this niche, a new firm must immediately possess:
- Proprietary chemical libraries targeting RAS variants.
- Deep expertise in ternary complex formation.
- Scientific teams skilled in structure-based drug design.
- Preclinical data validating selectivity over wild-type RAS.
- A clear path to initiate large-scale Phase 3 trials.
It's not just about having money; it's about having the specific, hard-won scientific know-how to crack a historically impenetrable target. That specialized talent and the associated proprietary data sets are not easily acquired. If onboarding takes 14+ days, churn risk rises-and here, the talent acquisition timeline is measured in years.
Disclaimer
All information, articles, and product details provided on this website are for general informational and educational purposes only. We do not claim any ownership over, nor do we intend to infringe upon, any trademarks, copyrights, logos, brand names, or other intellectual property mentioned or depicted on this site. Such intellectual property remains the property of its respective owners, and any references here are made solely for identification or informational purposes, without implying any affiliation, endorsement, or partnership.
We make no representations or warranties, express or implied, regarding the accuracy, completeness, or suitability of any content or products presented. Nothing on this website should be construed as legal, tax, investment, financial, medical, or other professional advice. In addition, no part of this site—including articles or product references—constitutes a solicitation, recommendation, endorsement, advertisement, or offer to buy or sell any securities, franchises, or other financial instruments, particularly in jurisdictions where such activity would be unlawful.
All content is of a general nature and may not address the specific circumstances of any individual or entity. It is not a substitute for professional advice or services. Any actions you take based on the information provided here are strictly at your own risk. You accept full responsibility for any decisions or outcomes arising from your use of this website and agree to release us from any liability in connection with your use of, or reliance upon, the content or products found herein.