
|
RWS Holdings plc (RWS.L) DCF Valuation |
Fully Editable: Tailor To Your Needs In Excel Or Sheets
Professional Design: Trusted, Industry-Standard Templates
Investor-Approved Valuation Models
MAC/PC Compatible, Fully Unlocked
No Expertise Is Needed; Easy To Follow
RWS Holdings plc (RWS.L) Bundle
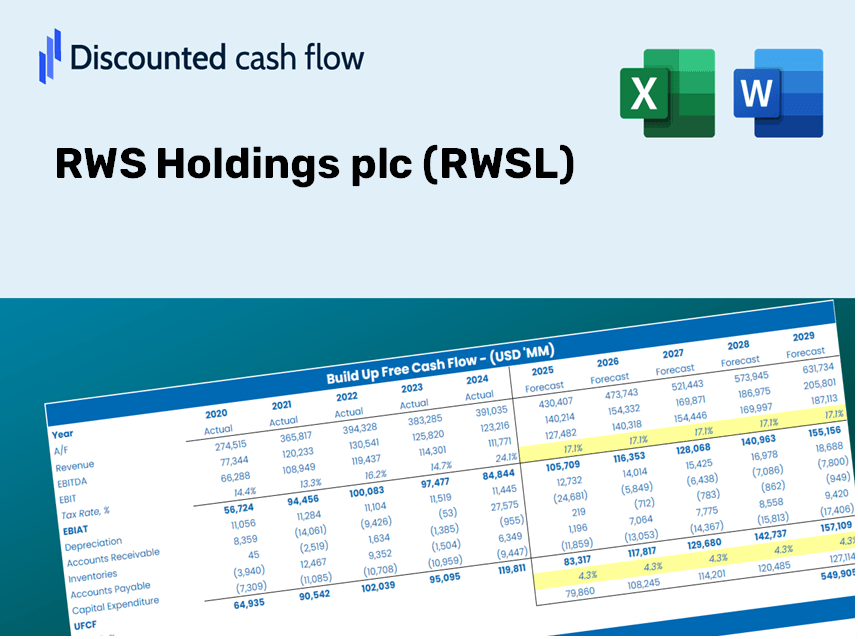
Simplify RWS Holdings plc valuation with this customizable DCF Calculator! Featuring real RWS Holdings plc financials and adjustable forecast inputs, you can test scenarios and uncover RWS Holdings plc fair value in minutes.
Discounted Cash Flow (DCF) - (USD MM)
| Year | AY1 2020 |
AY2 2021 |
AY3 2022 |
AY4 2023 |
AY5 2024 |
FY1 2025 |
FY2 2026 |
FY3 2027 |
FY4 2028 |
FY5 2029 |
|---|---|---|---|---|---|---|---|---|---|---|
| Revenue | 355.8 | 694.5 | 749.2 | 733.8 | 718.2 | 772.2 | 830.2 | 892.6 | 959.7 | 1,031.8 |
| Revenue Growth, % | 0 | 95.19 | 7.88 | -2.06 | -2.13 | 7.52 | 7.52 | 7.52 | 7.52 | 7.52 |
| EBITDA | 87.7 | 123.8 | 154.2 | 141.5 | 135.8 | 156.4 | 168.1 | 180.7 | 194.3 | 208.9 |
| EBITDA, % | 24.65 | 17.83 | 20.58 | 19.28 | 18.91 | 20.25 | 20.25 | 20.25 | 20.25 | 20.25 |
| Depreciation | 26.2 | 66.7 | 68.0 | 58.3 | 69.3 | 67.4 | 72.5 | 77.9 | 83.8 | 90.1 |
| Depreciation, % | 7.36 | 9.6 | 9.08 | 7.94 | 9.65 | 8.73 | 8.73 | 8.73 | 8.73 | 8.73 |
| EBIT | 61.5 | 57.1 | 86.2 | 83.2 | 66.5 | 89.0 | 95.7 | 102.8 | 110.6 | 118.9 |
| EBIT, % | 17.28 | 8.22 | 11.51 | 11.34 | 9.26 | 11.52 | 11.52 | 11.52 | 11.52 | 11.52 |
| Total Cash | 51.4 | 92.5 | 101.2 | 76.2 | 61.5 | 93.0 | 100.0 | 107.5 | 115.6 | 124.3 |
| Total Cash, percent | .0 | .0 | .0 | .0 | .0 | .0 | .0 | .0 | .0 | .0 |
| Account Receivables | 77.9 | 181.5 | 207.4 | 138.6 | 192.7 | 187.5 | 201.6 | 216.8 | 233.1 | 250.6 |
| Account Receivables, % | 21.89 | 26.13 | 27.68 | 18.89 | 26.83 | 24.29 | 24.29 | 24.29 | 24.29 | 24.29 |
| Inventories | .0 | .0 | .0 | .0 | .0 | .0 | .0 | .0 | .0 | .0 |
| Inventories, % | 0 | 0 | 0 | 0 | 0 | 0 | 0 | 0 | 0 | 0 |
| Accounts Payable | 21.7 | 28.1 | 30.2 | 25.7 | 25.1 | 32.7 | 35.2 | 37.8 | 40.6 | 43.7 |
| Accounts Payable, % | 6.1 | 4.05 | 4.03 | 3.5 | 3.49 | 4.23 | 4.23 | 4.23 | 4.23 | 4.23 |
| Capital Expenditure | -8.0 | -23.2 | -29.6 | -40.3 | -43.1 | -32.5 | -34.9 | -37.5 | -40.4 | -43.4 |
| Capital Expenditure, % | -2.25 | -3.34 | -3.95 | -5.49 | -6 | -4.21 | -4.21 | -4.21 | -4.21 | -4.21 |
| Tax Rate, % | 20.83 | 20.83 | 20.83 | 20.83 | 20.83 | 20.83 | 20.83 | 20.83 | 20.83 | 20.83 |
| EBITAT | 48.6 | 42.8 | 65.0 | 211.4 | 52.6 | 72.7 | 78.1 | 84.0 | 90.3 | 97.1 |
| Depreciation | ||||||||||
| Changes in Account Receivables | ||||||||||
| Changes in Inventories | ||||||||||
| Changes in Accounts Payable | ||||||||||
| Capital Expenditure | ||||||||||
| UFCF | 10.6 | -10.9 | 79.6 | 293.7 | 24.1 | 120.4 | 104.0 | 111.9 | 120.3 | 129.3 |
| WACC, % | 5.82 | 5.75 | 5.76 | 6.18 | 5.83 | 5.87 | 5.87 | 5.87 | 5.87 | 5.87 |
| PV UFCF | ||||||||||
| SUM PV UFCF | 493.8 | |||||||||
| Long Term Growth Rate, % | 2.00 | |||||||||
| Free cash flow (T + 1) | 132 | |||||||||
| Terminal Value | 3,409 | |||||||||
| Present Terminal Value | 2,563 | |||||||||
| Enterprise Value | 3,057 | |||||||||
| Net Debt | 40 | |||||||||
| Equity Value | 3,017 | |||||||||
| Diluted Shares Outstanding, MM | 372 | |||||||||
| Equity Value Per Share | 811.40 |
What You Will Receive
- Authentic RWS Data: Preloaded financials – covering everything from revenue to EBIT – derived from actual and projected figures.
- Comprehensive Customization: Modify all key parameters (yellow cells) such as WACC, growth % and tax rates.
- Immediate Valuation Updates: Automatic recalculations to assess the impact of changes on RWS Holdings’ fair value.
- Flexible Excel Template: Designed for quick adjustments, scenario analysis, and detailed forecasting.
- Efficient and Precise: Avoid the hassle of building models from the ground up while ensuring accuracy and adaptability.
Key Features
- Authentic RWS Financials: Gain access to precise historical data and future forecasts tailored for RWS Holdings plc (RWSL).
- Flexible Forecast Parameters: Modify the yellow-highlighted fields, such as WACC, growth rates, and profit margins.
- Real-Time Calculations: Automatically refresh DCF, Net Present Value (NPV), and cash flow assessments.
- Interactive Dashboard: Intuitive charts and summaries for clear visualization of your valuation outcomes.
- Designed for All Skill Levels: A user-friendly layout created for investors, CFOs, and consultants alike.
How It Operates
- Download the Template: Gain immediate access to the Excel-based RWS Holdings DCF Calculator.
- Input Your Assumptions: Modify the yellow-highlighted cells to set growth rates, WACC, profit margins, and other variables.
- Instant Calculations: The model will automatically compute RWS Holdings’ intrinsic value.
- Test Scenarios: Experiment with various assumptions to assess potential changes in valuation.
- Analyze and Decide: Utilize the outcomes to inform your investment or financial analysis strategies.
Why Choose This Calculator for RWS Holdings plc (RWSL)?
- User-Friendly and Accessible: Perfect for both novices and seasoned professionals.
- Customizable Inputs: Modify parameters easily to suit your analysis needs.
- Real-Time Updates: Instantly view changes to RWS Holdings' valuation as you adjust your inputs.
- Pre-Configured: Comes with RWS Holdings' latest financial data for swift evaluations.
- Widely Endorsed: Utilized by investors and analysts for informed decision-making.
Who Can Benefit from This Product?
- Finance Students: Master valuation techniques and apply them with real-world data.
- Academics: Integrate professional valuation models into your coursework or research projects.
- Investors: Validate your hypotheses and evaluate valuation scenarios for RWS Holdings plc (RWSL).
- Analysts: Enhance your efficiency with a customizable, pre-designed DCF model.
- Small Business Owners: Discover how major public companies like RWS Holdings plc (RWSL) are evaluated and analyzed.
What the Template Includes
- Detailed DCF Model: Editable template featuring comprehensive valuation calculations.
- Current Financial Data: RWS Holdings plc’s (RWSL) historical and projected financials preloaded for your analysis.
- Adjustable Parameters: Modify WACC, growth rates, and tax assumptions to explore various scenarios.
- Financial Statements: Complete annual and quarterly breakdowns for in-depth insights.
- Essential Ratios: Integrated analysis covering profitability, efficiency, and leverage metrics.
- Visual Dashboard: Charts and tables providing clear, actionable results.
Disclaimer
All information, articles, and product details provided on this website are for general informational and educational purposes only. We do not claim any ownership over, nor do we intend to infringe upon, any trademarks, copyrights, logos, brand names, or other intellectual property mentioned or depicted on this site. Such intellectual property remains the property of its respective owners, and any references here are made solely for identification or informational purposes, without implying any affiliation, endorsement, or partnership.
We make no representations or warranties, express or implied, regarding the accuracy, completeness, or suitability of any content or products presented. Nothing on this website should be construed as legal, tax, investment, financial, medical, or other professional advice. In addition, no part of this site—including articles or product references—constitutes a solicitation, recommendation, endorsement, advertisement, or offer to buy or sell any securities, franchises, or other financial instruments, particularly in jurisdictions where such activity would be unlawful.
All content is of a general nature and may not address the specific circumstances of any individual or entity. It is not a substitute for professional advice or services. Any actions you take based on the information provided here are strictly at your own risk. You accept full responsibility for any decisions or outcomes arising from your use of this website and agree to release us from any liability in connection with your use of, or reliance upon, the content or products found herein.